2026 Fibonacci Retracement Zone Confirmation: A Practical Guide to Filtering False Pullbacks with Volume Profile and OBV
Learn how to filter false Fibonacci pullbacks using high-volume nodes in volume profile and OBV, with practical steps and risk tips for technical traders.
⚠ This article is technical analysis research and does not constitute investment advice. Investing involves risk; please assess independently.
Key Takeaway: The reliability of Fibonacci retracement zones can be improved by using high-volume nodes (HVN) in volume profile and OBV trend confirmation to filter out false pullbacks, thereby tending to increase the win rate of trading decisions. However, this method does not guarantee results and should only serve as an auxiliary framework.
#What Is a Fibonacci Retracement Zone and How to Draw It Correctly?
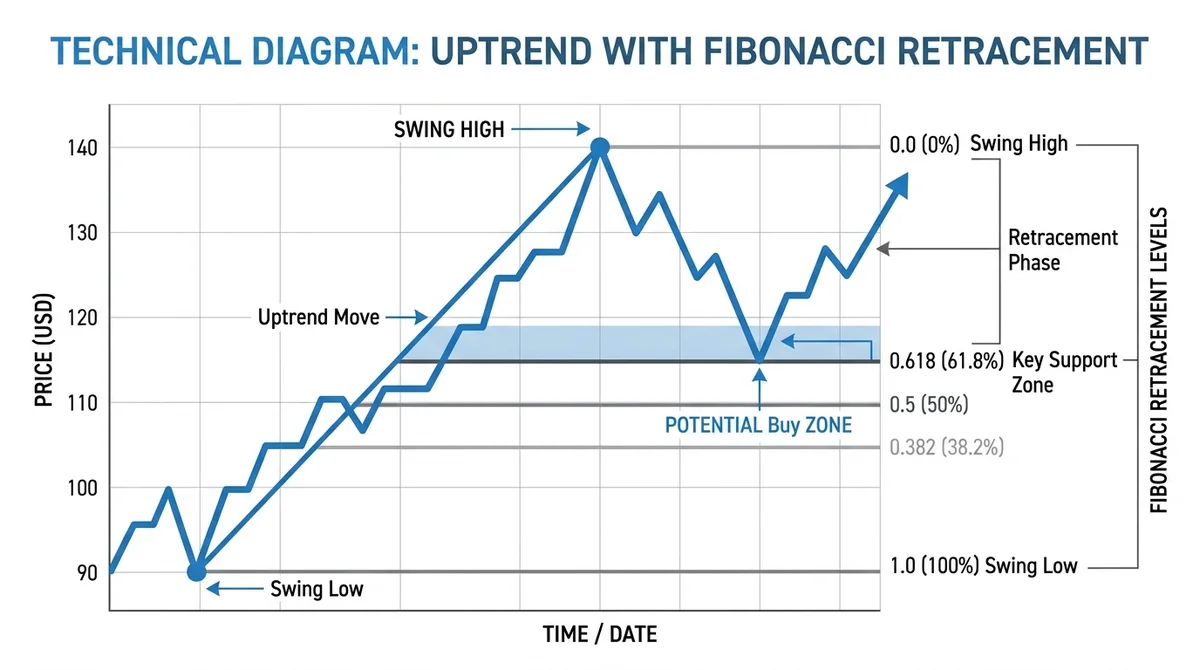
A Fibonacci retracement zone is a potential support or resistance area formed when price pulls back near Fibonacci retracement levels (such as 0.382, 0.5, 0.618) in an uptrend or downtrend. To draw Fibonacci retracement lines correctly, you need to connect a clear swing high and swing low: in an uptrend, connect from the swing low to the swing high; in a downtrend, connect from the swing high to the swing low. The system then automatically generates these key ratio levels, and price often pauses or reverses around them.
#What Are the Key Fibonacci Retracement Ratios?
Key Fibonacci retracement ratios include 0.236, 0.382, 0.5, 0.618, and 0.786, with 0.382, 0.5, and 0.618 receiving the most attention from traders. Core Point: 0.618 is known as the “golden retracement level” and usually represents a deeper pullback in a trending market; 0.382 is a shallow pullback, often seen in strong trends. These ratios are not absolute; historically, price reacts near these levels with relatively high frequency, but that does not mean a reversal is guaranteed.
#What Is the Difference Between a Retracement Zone and a Retracement Level?
A retracement level is a precise price level, whereas a retracement zone is an area formed by repeated tests around that level. Key Distinction: A retracement level is a line; a retracement zone is a band. Price may briefly pierce the retracement level and then quickly recover, so leaving a buffer zone above and below the level (e.g., ±1–2%) allows a more objective assessment of the pullback's validity. Traders should focus on closing behavior within the zone rather than intraday momentary pierces.
#Why Do Pullbacks Fail? What Are Common Causes of False Pullbacks?
A false pullback occurs when price pulls back to a Fibonacci retracement level but fails to find effective support or resistance, instead continuing to break through in the original trend direction, trapping traders who entered on the pullback. False pullbacks are a common pitfall in technical analysis, and understanding their causes helps filter out invalid signals.
#Which Market Conditions Tend to Cause False Pullbacks?
Weakening trend is the most fundamental cause. When the momentum of the original trend fades, buying or selling near the retracement level is insufficient to push price back to the original trend. In addition, sudden news shocks (such as earnings reports or macro data) can instantly shift the supply-demand balance and invalidate the retracement zone. Markets with insufficient liquidity (such as small-cap stocks or low-volume sessions) are also prone to false pullbacks because a small number of orders can push price significantly through key levels.
#How to Identify Pullbacks Lacking Volume Support?
Volume is an important clue for judging the authenticity of a pullback. Warning Signal: If volume shrinks significantly when price pulls back to a key level, it indicates insufficient active buying/selling, and the retracement zone may not hold. Conversely, a valid pullback typically features volume contraction during the pullback followed by volume expansion when the trend resumes. Looking only at price patterns while ignoring volume can easily lead to the trap of false pullbacks. For more discussion on pattern false breakouts, see “Technical Pattern Research: Confirmation Signals, Failure Cases, and Applications in the AI Compute Sector for Wedge Breakouts.”
#How to Use Volume Profile to Confirm the Validity of Fibonacci Pullbacks?
Volume Profile shows the distribution of accumulated trading volume over specific price ranges, helping to identify high-volume nodes (HVN) and low-volume nodes (LVN). Combining Fibonacci retracement levels with Volume Profile allows a more objective assessment of the support/resistance strength of the pullback zone.
#How Do High-Volume Nodes (HVN) in Volume Profile Correspond to Retracement Zones?
High-volume nodes usually represent price ranges with heavy turnover, indicating a strong consensus value area where price is likely to find support or resistance. Practical Implication: If a Fibonacci retracement level coincides with an HVN, the reliability of the retracement zone tends to be higher, because the double confirmation increases the probability of price pausing there. Conversely, if the retracement level is far from an HVN, support may be weaker.
#What Role Do Low-Volume Nodes (LVN) Play in Retracement Confirmation?
Low-volume nodes indicate price ranges with sparse trading, where price often moves through quickly without effective support or resistance. In retracement confirmation, if the retracement level falls within an LVN, you should be more cautious, because price may easily break through that area. Actionable Advice: When facing a pullback near an LVN, either wait for price to reclaim the key level before considering entry, or reduce position size.
#How to Use the OBV Indicator to Filter False Pullback Signals?
OBV (On-Balance Volume) reflects money flow by accumulating volume changes. Its calculation logic is: if today's closing price is higher than the previous day's, add today's volume to OBV; if lower, subtract it; if unchanged, leave it unchanged. Changes in OBV's slope and divergence signals can help judge the authenticity of a pullback.
#How to Apply OBV Divergence in Retracement Confirmation?
When price pulls back to the Fibonacci zone and makes a new low (or approaches the prior low), but OBV does not make a corresponding new low and instead remains rising or flat, this is called “bullish divergence,” which usually indicates that buying is still accumulating during the decline and the pullback is more likely just a temporary correction. Core Logic: OBV is considered to reflect money flow ahead of price, and divergence often signals trend continuation rather than reversal. Conversely, if OBV drops sharply in sync with price during the pullback, be alert that the trend may be changing.
#How to Combine OBV Trendlines with Price Pullbacks?
In addition to divergence, you can draw trendlines on the OBV indicator. If price pulls back while OBV remains above its own rising trendline, the probability of a valid pullback tends to be higher. Supplementary Judgment: When price breaks below the retracement zone, if OBV also breaks below its trendline simultaneously, the likelihood of the false pullback turning into a true breakout increases. Combining OBV with price patterns is similar to other momentum indicators but focuses more on the volume dimension. For more indicator filtering techniques, see “2026 ConnorsRSI Indicator Guide: Calculation Logic, Overbought/Oversold, and Trading Signal Identification.”
#What Are the Practical Steps for Combining Volume Profile and OBV?
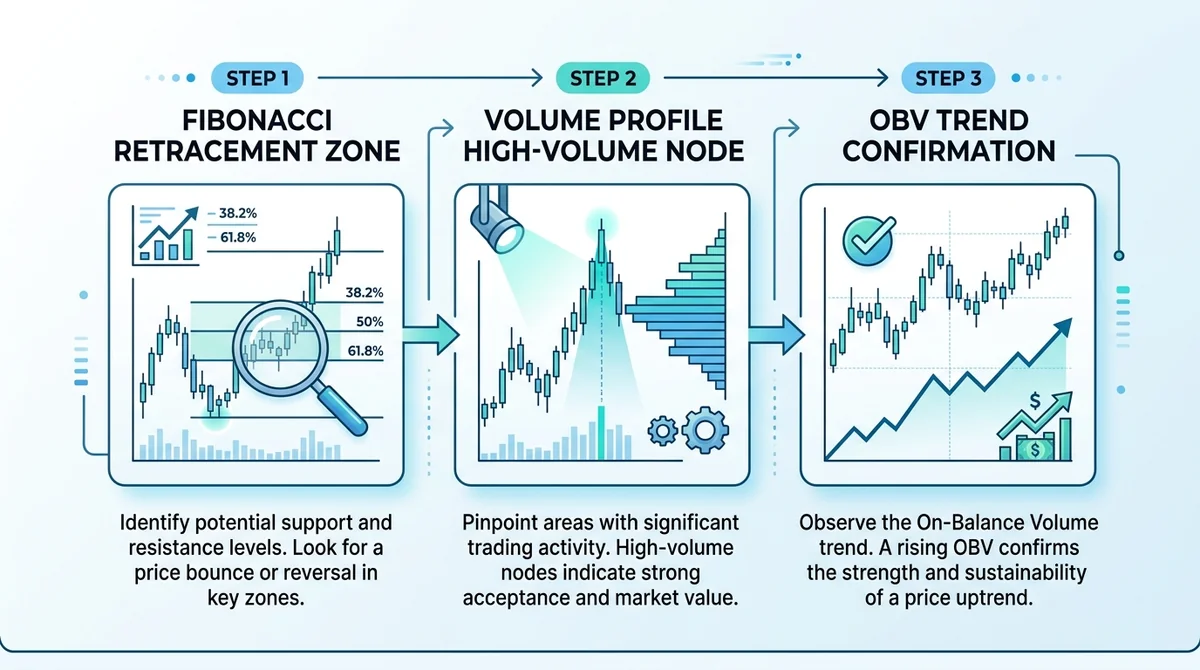
Combining Fibonacci retracement, Volume Profile, and OBV can form a relatively systematic pullback confirmation process. The following steps do not guarantee profits but provide a repeatable thinking framework.
#Step 1: How to Select High-Probability Fibonacci Retracement Zones?
First, draw Fibonacci retracement lines in a clear trend and focus on the 0.382, 0.5, and 0.618 levels. Prioritize retracement levels that coincide with previous high-volume trading areas, HVNs, or important technical levels (such as moving averages, prior highs, and prior lows). Selection Principle: The more confirming factors that overlap, the higher the potential reliability of the zone.
#Step 2: How to Use Volume Profile and OBV for Double Confirmation?
When price actually pulls back into the candidate zone, observe Volume Profile: is the retracement level near an HVN? If it falls within an LVN, lower your expectations. At the same time, check OBV: is there bullish divergence? Is OBV holding above its rising trendline? Double Confirmation: Only when Volume Profile shows strong support/resistance and OBV shows no negative divergence should you tend to consider the retracement zone valid.
#Step 3: How to Set Entry, Stop Loss, and Take Profit?
If the pullback is confirmed valid, you may consider entering within the zone or when price breaks above the high of the retracement zone. Stop Loss Placement: It should be set a certain distance below the retracement zone (e.g., 1–2% below the lower boundary) to avoid being stopped out by normal volatility. Take Profit Target: You can refer to the prior high (in an uptrend) or Fibonacci extension levels (such as 1.272, 1.618). For position management, it is advisable to control risk per trade based on personal risk tolerance, usually not exceeding 1–2% of the account.
Risks and Uncertainties: Technical analysis is based on historical statistical patterns and does not guarantee future performance. The reliability of Fibonacci retracements varies significantly across different markets and timeframes, and any single indicator or method can fail. Traders should combine fundamental analysis, market sentiment, and other multi-dimensional information for comprehensive judgment.
What to Watch Next: Track changes in Volume Profile and OBV behavior near key retracement levels for the instruments you trade, accumulate case studies, and gradually optimize your filtering rules.
#FAQ
Question 1: What is the difference between a Fibonacci retracement zone and a retracement level? A retracement level is a precise price level (such as 0.618), while a retracement zone is an area formed by repeated tests around that level, usually with a buffer band. When trading, focus on the zone rather than a single line.
Question 2: What do HVN and LVN represent in Volume Profile? HVN (High-Volume Node) is a price range with heavy turnover, usually representing strong support/resistance; LVN (Low-Volume Node) is a range with sparse trading, where price tends to move through quickly. A pullback landing on an HVN is more reliable.
Question 3: What does an OBV bullish divergence mean during a pullback? When price pulls back and makes a new low but OBV does not, it usually indicates that buying is still accumulating during the decline, the probability of trend continuation is higher, and the pullback is more likely a valid correction.
Question 4: How should I set a stop loss to avoid being stopped out by a false pullback? The stop loss should be set a certain distance below the retracement zone (such as 1–2%) rather than right at the lower boundary, to accommodate normal volatility. Combining ATR (Average True Range) for dynamic adjustment is also more reasonable.
Question 5: Is it enough to rely solely on Fibonacci pullback trading? No. Fibonacci retracements should be combined with volume, momentum indicators (such as OBV), trend structure, and other multiple filters, and they perform more stably in liquid markets and on longer timeframes.
FAQ
What is the difference between a Fibonacci retracement zone and a retracement level?
A retracement level is a precise price level (such as 0.618), while a retracement zone is an area formed by repeated tests around that level, usually with a buffer band. When trading, focus on the zone rather than a single line.
What do HVN and LVN represent in Volume Profile?
HVN (High-Volume Node) is a price range with heavy turnover, usually representing strong support/resistance; LVN (Low-Volume Node) is a range with sparse trading, where price tends to move through quickly. A pullback landing on an HVN is more reliable.
What does an OBV bullish divergence mean during a pullback?
When price pulls back and makes a new low but OBV does not, it usually indicates that buying is still accumulating during the decline, the probability of trend continuation is higher, and the pullback is more likely a valid correction.
How should I set a stop loss to avoid being stopped out by a false pullback?
The stop loss should be set a certain distance below the retracement zone (such as 1–2%) rather than right at the lower boundary, to accommodate normal volatility. Combining ATR (Average True Range) for dynamic adjustment is also more reasonable.
Is it enough to rely solely on Fibonacci pullback trading?
No. Fibonacci retracements should be combined with volume, momentum indicators (such as OBV), trend structure, and other multiple filters, and they perform more stably in liquid markets and on longer timeframes.
Related Terms
Ready to try? Test the strategy on MSX with small positions. Educational content only — not investment advice.