2026 Wedge Breakout Multi-Timeframe Confirmation Signals: How to Filter False Breakouts
Wedge breakouts often fail. Learn multi-timeframe confirmation, volume filters, and stop-loss/take-profit rules to avoid false breakouts. Educational only.
2026 Wedge Breakout Multi-Timeframe Confirmation Signals: How to Filter False Breakouts
This article is for technical analysis education only and does not constitute investment advice. Markets involve risk; decisions should be made with caution.
Core conclusion: The reliability of wedge breakout is generally associated with multi-timeframe synchronization and volume confirmation. A breakout on a single timeframe is more likely to fall into a false breakout trap, but no signal can guarantee success.
#What is a wedge breakout? Why is it prone to false breakouts?
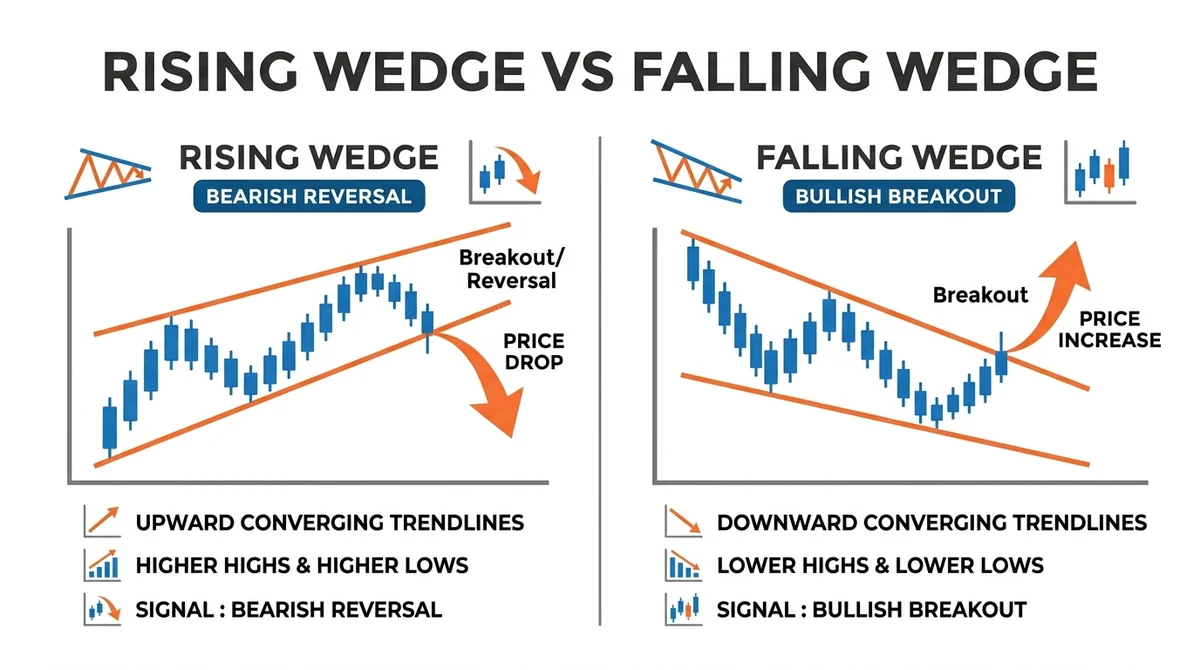
Definition: A wedge is a pattern in which price moves between two converging trendlines that slope in the same direction. It is divided into rising wedge and falling wedge. A rising wedge is traditionally viewed as a potential reversal signal at the end of an uptrend; a falling wedge often appears at the end of a downtrend and is considered a potential upward breakout pattern.
Pattern characteristics: Near the end of a wedge, price swings typically narrow gradually, price presses toward the boundary, and breakouts often occur at the late stage of the pattern. At this time, the battle between bulls and bears may intensify, with more bull traps and bear traps.
Causes of false breakouts: At the end of a wedge, if there is insufficient volume support or a lack of higher-timeframe trend confirmation, price can quickly reverse after briefly breaking the boundary, forming a false breakout. However, this is not inevitable, and it varies significantly across market environments.
#What is the difference between a rising wedge and a falling wedge?
In a rising wedge, both trendlines slope upward but their slopes typically decrease, and the traditional view is that it is more common as a reversal at the end of an uptrend. A falling wedge has two downward-sloping trendlines, often appears at the end of a downtrend, and tends to break upward. The two point in opposite directions, but both suggest that the original trend momentum may be weakening. Actual price action needs to be judged with other conditions.
#Why are false breakouts frequent in wedge patterns?
The narrowing swings near the end of a wedge often mean dense stop-loss orders and reduced liquidity, so a small amount of capital can push price through the boundary. If volume is weak at the breakout or higher timeframes do not confirm, the probability of price falling back into the pattern may increase. But this is only an empirical observation, and not all wedge endings produce false breakouts.
#What exactly are multi-timeframe confirmation signals?
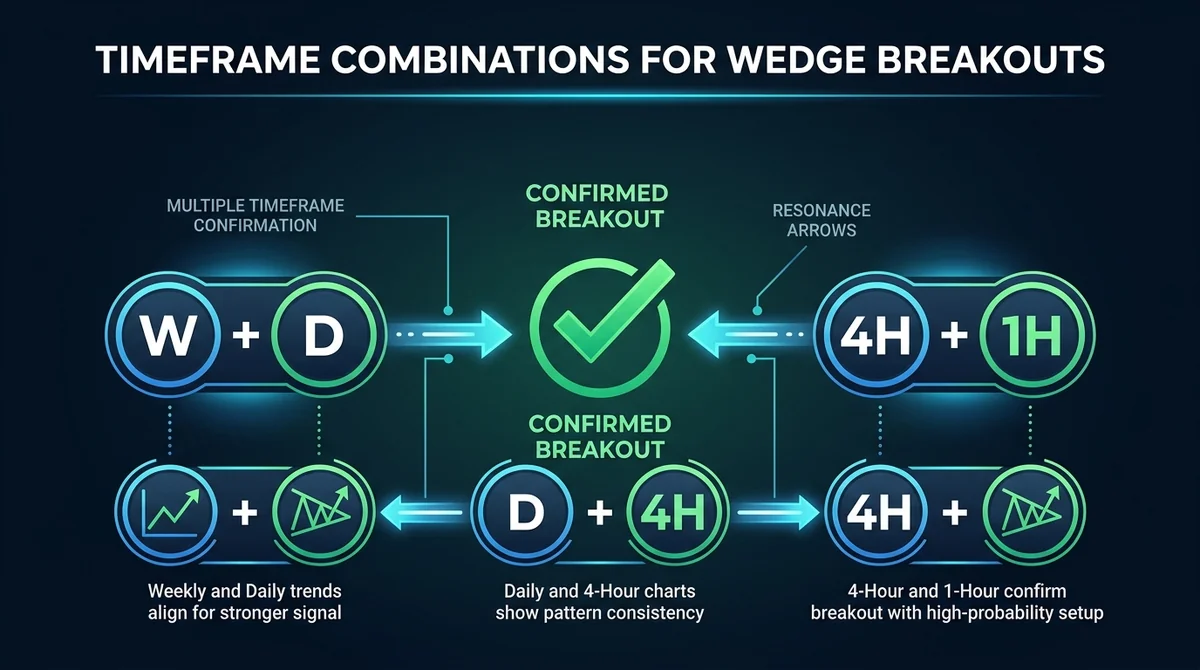
Definition: Multi-timeframe confirmation signals require price to break the wedge boundary on at least two adjacent timeframes at the same time, such as a synchronized breakout on the daily and 4-hour charts, or on the 4-hour and 1-hour charts.
Role: The larger timeframe helps determine the main direction, while the smaller timeframe provides entry timing. When two timeframes resonate, the probability of a false breakout is generally considered lower, but failure cannot be completely ruled out.
#Which timeframe combinations are most suitable for wedge breakouts?
Common combinations include: weekly + daily, daily + 4-hour, and 4-hour + 1-hour. Choosing adjacent timeframes rather than those with excessive gaps can strike a balance between direction confirmation and entry precision, but "most suitable" varies by trading style and market.
#How do multi-timeframe signals improve breakout reliability?
A synchronized multi-timeframe breakout may mean that participants with different holding periods form more consistent expectations, and buying or selling pressure has broader absorption. A single-timeframe breakout often only reflects short-term noise and is empirically more likely to fail. However, this "resonance" may also be just a short-term synchronization driven by the same news.
#What role does volume confirmation play in filtering false breakouts?
Role: Volume is a common auxiliary signal used to distinguish valid breakouts from false breakouts. A valid breakout is often accompanied by rising volume, indicating higher capital participation. A breakout on shrinking volume often lacks sustainability and has a higher risk of pullback after the breakout. But volume can also be manipulated and cannot be used as the sole basis for confirmation.
Note: Volume-price divergence (price making a new high but volume shrinking) should be treated with caution, but it is also not decisive evidence.
#What are the volume characteristics of a valid breakout?
Empirically, the volume on the breakout candle is significantly higher than the recent average volume, and then volume shrinks during the subsequent retest and expands again when price rises again. The volume structure follows a "surge-shrink-surge" rhythm. This characteristic is not exactly the same across different markets and instruments.
#Why is a breakout on shrinking volume unreliable?
A breakout on shrinking volume means that limited capital is pushing price through the key boundary, and neither bulls nor bears have formed an overwhelming advantage. Price tends to seesaw near the boundary and eventually return to the original range. However, a shrinking-volume breakout occasionally evolves into a real breakout, so it needs to be combined with other signals.
#How to execute a wedge breakout multi-timeframe confirmation strategy step by step?
The following steps are a general framework and do not guarantee profits. Adjust them according to your personal risk tolerance.
Step 1: Identify the pattern. Mark the upper and lower boundaries of the wedge formed by at least two valid touchpoints on the chart, and confirm that the pattern structure is complete.
Step 2: Wait for a synchronized multi-timeframe breakout. At least two timeframes should close beyond the boundary, not just pierce it intraday.
Step 3: Volume verification. Volume at the breakout should be higher than the recent average, preferably accompanied by open interest or capital flow confirmation; but be wary of wash trading volume.
Step 4: Set risk management. The stop-loss can be placed just beyond the internal swing low/high of the wedge, and the take-profit can reference the pattern height or a risk-reward ratio of at least 1:2, but the actual ratio should be adjusted according to volatility and liquidity.
#What preparations are needed before execution?
Confirm that the trading instrument has good liquidity and moderate volatility; record the wedge boundaries and historical average volume; define the acceptable loss per trade to avoid making impulsive decisions during the session.
#What are the specific steps to identify a wedge and wait for the breakout?
First confirm the wedge pattern on a larger timeframe, then switch to a smaller timeframe to observe whether price is approaching the boundary. When price touches the boundary, watch for high-volume candles and whether multiple timeframes break out simultaneously.
#How to set stop-loss and take-profit after a breakout?
The stop-loss is usually placed on the opposite side of the breakout direction, just beyond the nearest swing low/high inside the wedge. The take-profit can reference the height projection of the widest part of the wedge, or exit in batches based on previous support/resistance levels. Different instruments may require adjusting the stop distance due to volatility.
#What common traps cause false breakouts to be misjudged?
Trap 1: Ignoring retest confirmation. After a breakout, price often retests the original boundary. If the retest holds and volume expands again, the confirmation may be higher; chasing immediately may expose you to pullback. However, a retest does not always occur, and waiting for a retest may also cause you to miss the move.
Trap 2: Overreliance on a single indicator. Focusing only on price breakout while ignoring volume or multiple timeframes makes you easily misled by false signals.
Trap 3: Ignoring the broader market environment. In an environment of systemic risk or low volatility, the failure rate of wedge breakouts may increase.
#How to avoid the trap of a quick reversal after a breakout?
Wait for the closing price to hold beyond the boundary, avoid entering when only the wick pierces it, and combine volume expansion with a retest confirmation on a lower timeframe. This can reduce the damage from a quick reversal after the breakout, but it cannot completely avoid it.
#Which technical indicators and volume signals are easily misread?
A single high-volume candle is not always valid; you need to observe whether volume is sustained. Oscillators such as RSI divergence can provide auxiliary help, but they cannot be used as the sole entry basis. Trend indicators such as Aroon can also be used to judge trend strength, but they likewise need to be combined with price action.
#Risk and Disclaimer
Technical analysis signals are not 100% effective, and wedge breakout strategies carry the risk of loss. Historical performance does not represent future results. Differences in microstructure and liquidity across markets (such as cryptocurrency and US stocks) can significantly affect strategy performance. This article is for technical analysis education only and does not constitute any investment advice; trading decisions should be made at your own responsibility.
FAQ
Why does a wedge breakout need multi-timeframe confirmation?
Multi-timeframe confirmation can filter out noise signals on a single timeframe to a certain extent. When larger and smaller timeframes break the wedge boundary simultaneously, it usually means that participants with different holding periods form consistent expectations, and the probability of a false breakout is lower, but it is not guaranteed.
Is a shrinking-volume breakout always a false breakout?
A shrinking-volume breakout does not necessarily fail, but it is generally considered less reliable than a breakout on rising volume. Shrinking volume indicates limited capital pushing price through the boundary and a higher risk of subsequent pullback, so it should be treated with caution and combined with other signals.
Is it normal for price to retest the boundary after a breakout?
It is common for price to retest the original boundary after a breakout, but it does not always happen. If the retest holds and volume expands again, it usually strengthens the validity of the breakout; chasing immediately may expose you to a larger pullback.
Is this strategy suitable for all trading instruments?
In theory, this strategy is suitable for instruments with good liquidity and moderate volatility, but actual performance may vary depending on market microstructure, trading costs, and other factors. Instruments with too low liquidity or excessive volatility tend to produce more false signals, and the strategy needs to be adjusted according to the market environment.
Besides volume, what other confirmation signals can be referenced?
You can combine auxiliary tools such as the relative strength index, Aroon trend indicator, and moving average alignment. However, any single indicator has limitations, so it is recommended to combine price action and multi-timeframe structure for a comprehensive judgment and to implement proper risk management.
Related Terms
Ready to try? Test the strategy on MSX with small positions. Educational content only — not investment advice.