2026 Crypto Market Volatility Surface Study: Option Implied Volatility Structure, Skew, and Trading Strategy Signals
Crypto options IV surfaces: term structure, skew, and pricing of short- vs long-term and upside vs downside risk, with strategy signals and risks.
⚠ This article is a digital asset multi-asset research piece and does not constitute investment advice. Investing involves risk; please make decisions prudently.
A volatility surface is not a crystal ball for predictions; it is a tool that visualizes how the options market prices implied volatility across different maturities and strike prices, helping identify pricing discrepancies and shifts in risk appetite.
#Core Conclusions
Core conclusion: The crypto options implied volatility surface shows how the market prices volatility risk across two dimensions—maturity and strike price. Changes in its structure and skew are important signals for observing risk appetite and relative value opportunities. However, surface signals contain noise and model risk and should not be the sole basis for decisions.
#Underlying/Business Line Definition
Research boundary: This article focuses on the options market for crypto spot assets (BTC, ETH, etc.), especially standard European options and related derivatives. The object of study is not the spot asset itself, but the market expectations reflected by the options implied volatility surface. Note: Options are derivatives; their prices and implied volatility are influenced by supply and demand, liquidity, and market sentiment, and are not equivalent to spot price direction.
#Key Mechanisms and Data
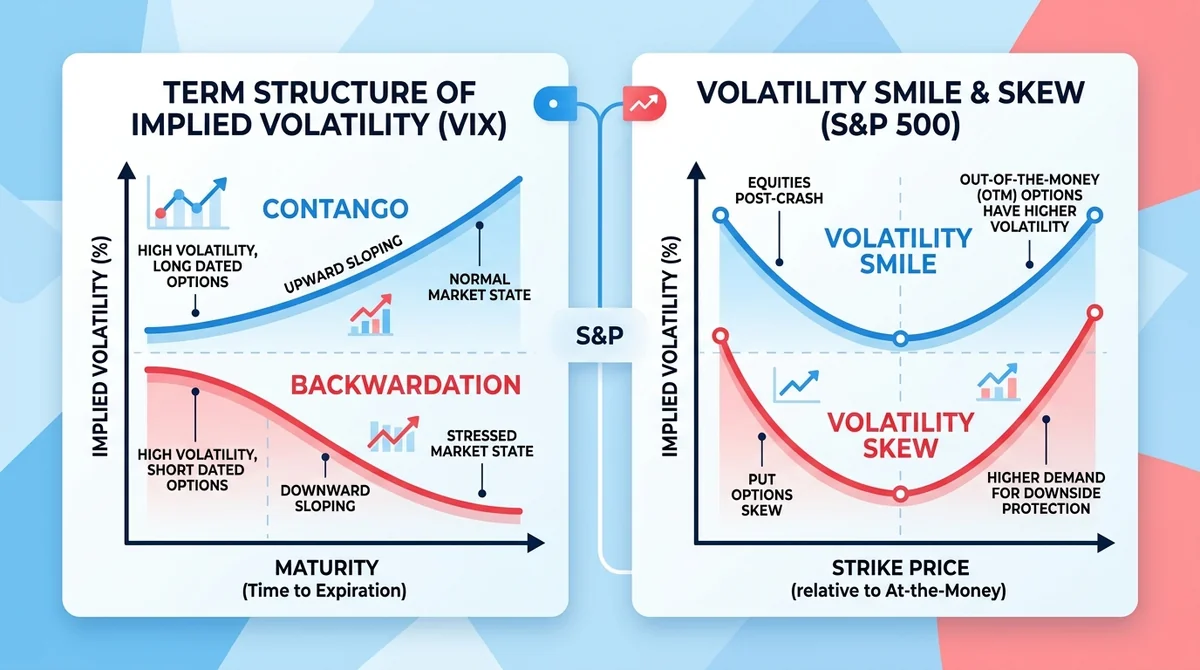
Mechanism: The volatility surface consists of three dimensions: time to maturity, strike price, and implied volatility. Implied volatility is a volatility parameter derived from option market prices, reflecting market expectations of future volatility rather than realized volatility. The term structure can show contango (farther maturities higher than near) or backwardation (near maturities higher than farther), while the strike dimension exhibits a volatility smile or skew.
Data note: Because this is a methodological study, no specific figures are cited; always check real-time quotes when trading. Data comes from public market data as of the 2026 writing date, but specific data sources and platforms have not been individually verified.
#Core Drivers
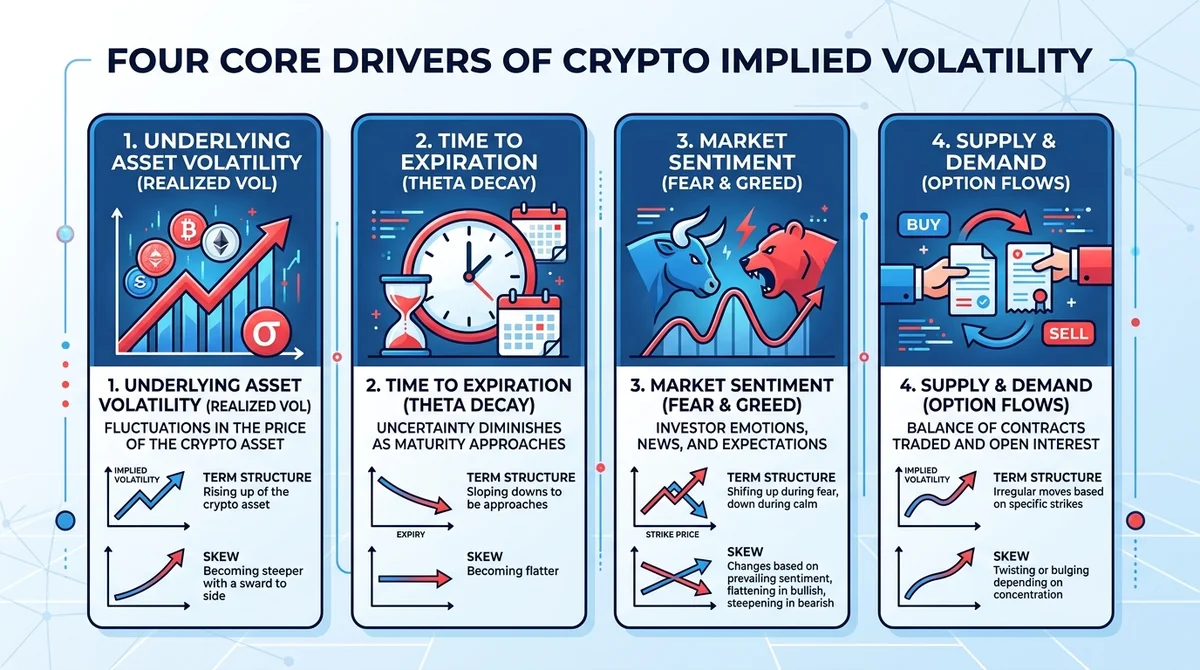
Driver 1: Expectations of short-term events (such as macro data, regulatory announcements, halvings, etc.) may push up near-term implied volatility, creating changes in the term structure.
Driver 2: When demand for downside protection rises, demand for out-of-the-money put options may increase, typically steepening the skew and reflecting risk-averse sentiment; however, correlation does not imply causation.
Driver 3: Liquidity tiering and market maker inventory management can affect the local shape of the surface, especially at strike prices with poor depth.
Driver 4: Institutional hedging activity (such as ETF and miner hedging) may alter option supply and demand, thereby affecting implied volatility, but the specific direction and magnitude should be assessed with order flow data.
#Key Participants
Participants: Mainstream crypto options exchanges and market makers provide liquidity and pricing (platforms are not listed individually; refer to real-time market data for specific platforms); institutional investors and miners are important hedging counterparties; retail traders contribute part of the demand for out-of-the-money options. Note: This article does not recommend any platform or asset, only factual description.
#Risks and Disagreements
Bearish view: Some argue that the crypto options market lacks sufficient liquidity, so implied volatility is noisy and surface signals may be distorted in extreme market conditions. Risk: Surface model assumptions (such as lognormal distribution) may not match reality, and tail risk pricing may deviate; strict stop-loss and stress testing are required when strategy signals fail; moreover, trading costs, funding rate, slippage, etc. can erode strategy returns, and this article does not provide specific calculations.
#What to Watch Next
To monitor: Watch the distribution of BTC/ETH options open interest, changes in term structure slope, movements in skew indicators (such as 25-delta risk reversal), and surface adjustments before and after major macro events. It is recommended to validate signals with trading volume, liquidity indicators, and order flow data, and guard against model overfitting.
#FAQ
Question 1: Can the volatility surface predict price direction?
Answer: No. The surface reflects volatility expectations, not price direction; directional trading requires combining other signals.
Question 2: Which is more important, implied volatility or historical volatility?
Answer: Implied volatility is a forward-looking indicator, while historical volatility is a realized indicator; option pricing primarily uses implied volatility, but historical volatility still has reference value for calibration and risk assessment.
Question 3: What does a steepening volatility skew mean?
Answer: It usually means out-of-the-money put options are more expensive relative to call options, and market hedging or downside protection demand may be rising, but it can also reflect market maker inventory pressure or liquidity changes.
Question 4: Can ordinary traders directly trade the volatility surface?
Answer: You cannot directly trade the "surface" itself, but you can express views indirectly through option combinations (such as straddles, strangles, calendar spreads) or volatility derivatives, provided you understand Greeks and margin risks and evaluate trading costs beforehand.
FAQ
Can the volatility surface predict price direction?
No. The surface reflects volatility expectations, not price direction; directional trading requires combining other signals.
Which is more important, implied volatility or historical volatility?
Implied volatility is a forward-looking indicator, while historical volatility is a realized indicator; option pricing primarily uses implied volatility, but historical volatility still has reference value for calibration and risk assessment.
What does a steepening volatility skew mean?
It usually means out-of-the-money put options are more expensive relative to call options, and market hedging or downside protection demand may be rising, but it can also reflect market maker inventory pressure or liquidity changes.
Can ordinary traders directly trade the volatility surface?
You cannot directly trade the "surface" itself, but you can express views indirectly through option combinations (such as straddles, strangles, calendar spreads) or volatility derivatives, provided you understand Greeks and margin risks and evaluate trading costs beforehand.
Related Terms
Ready to try? Test the strategy on MSX with small positions. Educational content only — not investment advice.