2026 Crypto Market Sector Rotation and Capital Flow Tracking Research: Rotation Signals for DeFi, Layer2, AI, and Meme
MSX Trading Lab: crypto sector rotation signals for DeFi, Layer2, AI, and Meme—track capital flows via on-chain and exchange data to reveal drivers/risks.
2026 Crypto Market Sector Rotation and Capital Flow Tracking Research: Rotation Signals for DeFi, Layer2, AI, and Meme
⚠ This article is digital asset multi-asset research and does not constitute investment advice. Investing involves risk; please make decisions prudently.
Core conclusion: Crypto market sector rotation is essentially the reallocation of capital among different narratives and tracks; DeFi, Layer2, AI, and Meme each have different leading signals that can be tracked via on-chain and exchange data.
Key questions addressed: What are the main signals of crypto market sector rotation in 2026? How do rotation signals differ between DeFi and Layer2? How can risks in the AI and Meme sectors be quantified? How can ordinary investors build a capital flow monitoring framework?
Underlying/business line definitions: The sectors studied in this article include DeFi (decentralized finance), Layer2 (Ethereum scaling solutions), AI (artificial intelligence-related crypto projects), and Meme (community-driven tokens), corresponding to spot, perpetual contracts, and related tokens; tokenized US equity assets (such as AI computing power targets) are used as cross-market references.
#What is crypto market sector rotation? How to track capital flows?
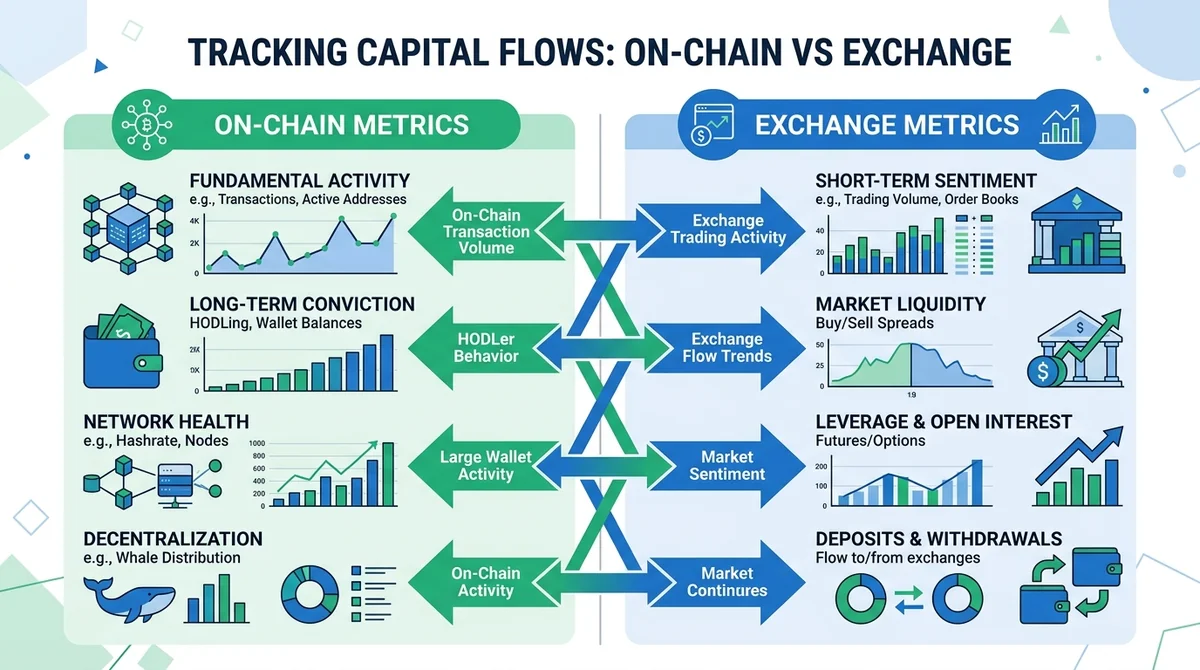
Sector rotation refers to capital flowing out of some sectors and into others, causing the relative strength of different tracks to change continuously. Common classification dimensions include: by underlying asset class (spot, perpetual contracts, tokenized stocks, RWA, etc.), by public chain ecosystem (Bitcoin network, Ethereum ecosystem, Solana ecosystem, etc.), and by narrative theme (DeFi, Layer2, AI, Meme, etc.). The core data sources for tracking capital flows are divided into on-chain metrics and exchange metrics; the two are complementary, with on-chain reflecting medium- to long-term address behavior and protocol usage, while exchange reflects short-term speculation and leverage sentiment.
#What are the common classification dimensions of sector rotation?
In addition to narrative themes, sectors can also be classified by asset risk attributes, such as "value" sectors (BTC, ETH) and "growth/narrative" sectors (DeFi, AI, Meme). Historical experience shows that capital often flows into core assets first and then spills over into small- and mid-cap tracks, but this path is not a fixed rule and needs to be assessed with the prevailing macro and liquidity environment.
#What are the core data sources for tracking capital flows?
On-chain data sources include active address count, transaction amount, newly created addresses, exchange net inflow/outflow, stablecoin supply changes, and contract interaction count; exchange data includes trading volume, open interest, funding rate, spot-contract premium (basis), long/short position ratio, etc. Combining these metrics can more fully capture the flow of capital among spot, perpetual contracts, and on-chain protocols.
#How do on-chain metrics and exchange data complement each other?
On-chain metrics are suitable for observing medium- and long-term holder behavior and actual protocol usage, for example, TVL changes reflect liquidity inflows and outflows, and active addresses reflect user retention. Exchange metrics are suitable for observing short-term trading sentiment and leverage levels, for example, funding rate extremes often correspond to overcrowded trade directions. Cross-validating the two can reduce the probability of misjudgment from a single data source; all data used in this article comes from public disclosures and MSX market data, as of 2026-02.
#What leading indicators exist for DeFi sector rotation signals?
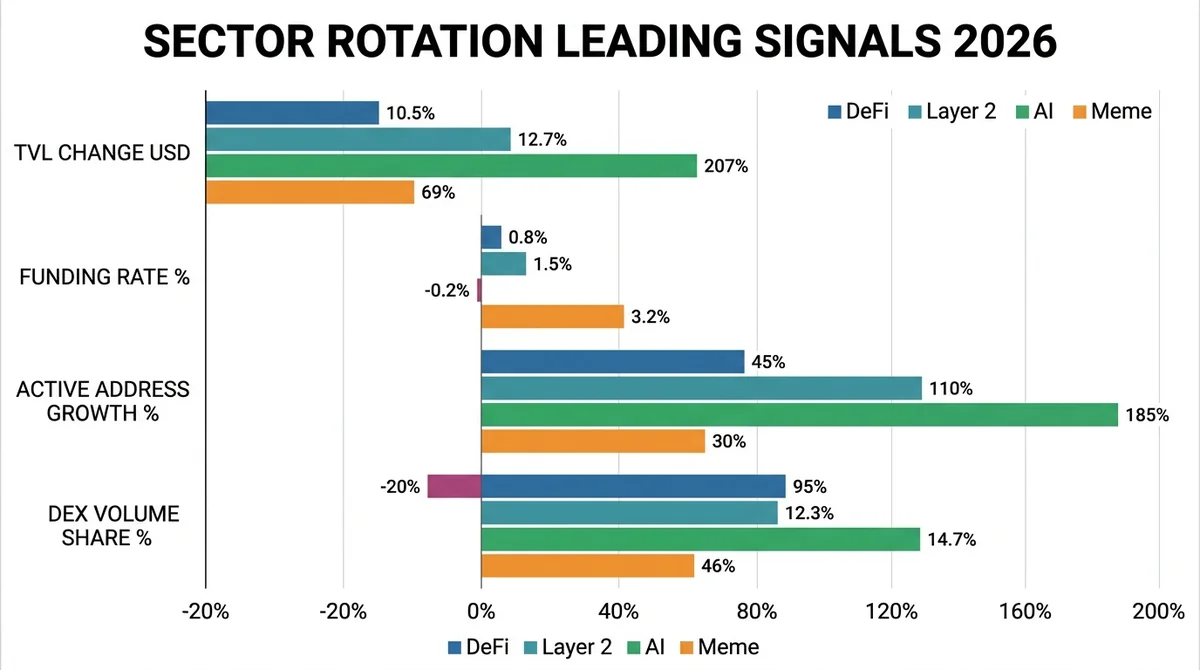
DeFi rotation signals typically manifest as rising total value locked (TVL), growth in protocol revenue, and relatively strengthening governance token prices. Among them, DEX trading volume expansion and changes in lending rates are more sensitive leading indicators because they directly reflect actual on-chain demand and capital costs, rather than just price movements. As of 2026-02, according to public data such as DeFiLlama, capital inflows usually first appear as rising utilization rates in lending protocols and stablecoin net inflows, rather than just price increases.
#What are typical signals of capital inflows into the DeFi sector?
Typical signals include: deposit rates in major lending protocols rising while borrowing utilization also increases; DEX daily trading volume expanding significantly with lower slippage; stablecoin net inflows into DeFi protocols increasing; and governance token staking ratios rising. When these signals resonate, the certainty of capital inflows tends to strengthen, but one should be wary that a single signal may be caused by localized activity or technical factors.
#How do TVL and protocol revenue reflect rotation?
TVL measures the total asset value deposited in DeFi protocols, and its changes directly reflect capital entry and exit; protocol revenue comes from trading fees, lending spreads, etc., and revenue growth indicates rising demand. However, note that TVL is also affected by asset price fluctuations, so more attention should be paid to net inflow volume after excluding price factors. For specific values, please refer to public disclosure data such as DeFiLlama, as of 2026-02.
#Which DeFi sub-sectors are most sensitive?
Lending, DEX, and liquid staking sub-sectors are most sensitive to capital inflows. Representative participants include leading DEXs, lending protocols, and liquid staking protocols, which together account for a high share of total value locked; however, this article only presents research facts and does not constitute any recommendation of specific targets.
#How to identify rotation signals in the Layer2 sector?
Layer2 rotation signals include growth in on-chain transaction volume, improved user experience from lower Gas fees, and concentration of capital toward leading Rollup ecosystems. These factors may collectively drive L2 token performance, but it should be noted that token value capture mechanisms are not yet fully mature.
#What does Layer2 transaction volume growth indicate?
Sustained growth in transaction volume means more activity migrating from L1 or new demand, usually accompanied by an increase in active addresses and higher frequency of DApp interactions. However, transaction volume growth may also come from airdrop expectations or short-term incentives, and should be assessed together with user retention rates.
#The relationship between Gas fees and Rollup activity
Gas fees are the cost of Rollup publishing to L1, and lower fees can directly reduce costs for users and developers, stimulating more transactions. However, excessively low Gas fees may also reflect improved Rollup batch processing efficiency rather than falling demand, and should be evaluated together with transaction counts.
#The value capture logic of L2 tokens
Currently, the value capture of mainstream L2 tokens mainly relies on sequencer revenue, MEV, and ecosystem governance rights. However, most L2s are still in a subsidized growth stage, and tokens serve more governance and incentive functions, so direct value capture signals are weak. Key participants include mainstream Rollup ecosystems, but note that the L2 landscape is still changing rapidly.
#How do rotation signals differ between AI and Meme sectors?
AI sector rotation is strongly correlated with technological progress, funding events, and computing power demand; Meme sector depends more on social sentiment, community heat, and celebrity effects. Both are usually more volatile than fundamental sectors, but projects vary greatly.
#What factors drive AI sector rotation?
Driving factors include: breakthroughs in large model capabilities, upward revisions in cloud vendor capital expenditure guidance, large funding rounds for AI-related token projects, and price performance linkages with leading US AI stocks. The business substance of crypto AI projects varies greatly; distinguishing "with real computing power or data services" from "merely borrowing the AI narrative" is particularly important; specific data comes from public disclosures and MSX market data, as of 2026-02.
#How can social sentiment indicators for the Meme sector be quantified?
Common quantitative indicators include social media mention growth rate, KOL influence, community member growth, Google Trends search heat, and derivative funding rate extremes. Meme coin community heat changes extremely quickly; funding rates remaining at extreme positive or negative values for long periods often suggest short-term overcrowding and reversal risk, but this signal is not absolute and extreme values may persist for a long time.
#Why is narrative-driven rotation more volatile?
Narrative-driven sectors lack stable cash flows or fundamental anchors, so prices can rise and fall quickly in a short period. Historically, Meme sector rotation cycles are shorter than DeFi and Layer2, and drawdowns are deeper, but specific cycle lengths and amplitudes are greatly influenced by market conditions. Investors should be wary of FOMO and avoid chasing rallies based solely on narratives.
#How to build a crypto market observation framework using rotation signals?
The observation framework should integrate on-chain data, exchange metrics, and social sentiment to form a multi-indicator monitoring dashboard; when multiple indicators resonate in the same direction, rotation signals become more reliable.
The table below summarizes leading indicators and typical risks for the four sectors for quick comparison:
| Sector | Leading indicators (on-chain) | Leading indicators (exchange/sentiment) | Typical risks |
|---|---|---|---|
| DeFi | DEX trading volume, lending rates and utilization, TVL net inflows | Funding rate, governance token staking ratio | TVL disturbed by price fluctuations |
| Layer2 | On-chain transaction volume, Gas fees, Rollup active addresses | Token listing events, airdrop expectations | Weak token value capture |
| AI | Computing power-related contract interactions, funding events | Linkage with leading US AI stocks, funding rate | Narrative diverging from business substance |
| Meme | Social mentions, community member growth | Funding rate extremes, KOL influence | Extremely high volatility, short cycles |
#How can ordinary investors monitor capital flows?
Public tools can be used: DeFiLlama to track TVL; CoinGecko to track prices and trading volume; Glassnode to track on-chain metrics; exchange APIs to track funding rates and open interest. For ordinary people, paying attention to stablecoin net inflows, funding rates of major assets, DeFi TVL changes, and leading Layer2 transaction volumes can provide a basic sense. All data should be checked against real-time sources; data in this article is as of 2026-02, with reference to MSX market data.
#What risks should be watched after rotation signals appear?
Main risks include: rotation may be driven by leveraged capital, and can reverse quickly once liquidity tightens or regulations change; different data sources have statistical biases and may send misleading signals; chasing rallies late in the rotation often faces large drawdowns; in addition, overlooked costs such as impermanent loss, token inflation, and trading slippage should be considered. The bearish view argues that crypto sector rotation is highly speculative and lacks long-term fundamental support.
#What are common mistakes to avoid?
Common mistakes include: drawing conclusions based on a single indicator; ignoring the interference of asset price fluctuations on TVL; equating narrative heat with real demand; overusing leverage during the acceleration phase of rotation; and holding high-volatility narrative assets for long periods without exit rules.
What to watch next: Federal Reserve policy expectations and global liquidity changes; Bitcoin spot ETF flows; DeFi protocol upgrades and token buyback programs; Layer2 ecosystem milestones (such as token listings, major integrations); AI-related funding and product launches; Meme community activity and celebrity moves. These are events to monitor, not trading advice.
#Frequently Asked Questions (FAQ)
Q: What is crypto market sector rotation? A: Sector rotation is the process of capital reallocating among different narratives and tracks, usually showing some sectors relatively strengthening in price while others weaken. It can be tracked via indicators such as on-chain TVL, exchange funding rates, and stablecoin net inflows.
Q: What are the three most important indicators for tracking capital flows? A: Focus on on-chain TVL changes, exchange funding rates and open interest, and stablecoin net inflows, cross-validating them to reduce misjudgment. As of 2026-02, these three indicators often lead spot price changes during the acceleration phase of rotation.
Q: What are the leading signals for DeFi sector rotation? A: Expansion of DEX trading volume, changes in lending rates and utilization, and rising governance token staking ratios. Among them, DEX trading volume and lending utilization changes most directly reflect actual on-chain demand.
Q: What are the main differences between Layer2 and Meme sector rotation signals? A: Layer2 relies more on on-chain transaction volume, Gas fees, and TVL migration; Meme relies more on social sentiment and funding rate extremes, with greater volatility. Both should be validated with open interest.
Q: How should ordinary investors use rotation signals? A: Build a multi-indicator monitoring panel, set risk management rules, avoid chasing rallies and selling dips based on a single narrative, and consider trading costs and impermanent loss.
Q: What are the main signals of crypto market sector rotation in 2026? A: Main signals include DEX trading volume expansion, changes in lending rates and utilization, stablecoin net inflows, Layer2 transaction volume growth, AI funding and computing power demand, Meme social heat and funding rate extremes. When multiple indicators resonate in the same direction, rotation signals become more reliable.
Q: How do rotation signals differ between DeFi and Layer2? A: DeFi relies more on DEX trading volume, lending rates, and TVL net inflows; Layer2 relies more on on-chain transaction volume, Gas fees, and Rollup activity. Both should be validated with exchange funding rates and open interest.
Q: How can risks in the AI and Meme sectors be quantified? A: For AI, track breakthroughs in large models, cloud vendor capital expenditures, and linkages with leading US AI stocks; for Meme, use social media mention growth rate, KOL influence, and funding rate extremes. Both are usually more volatile than DeFi and Layer2, requiring caution against FOMO.
FAQ
What is crypto market sector rotation?
Sector rotation is the process of capital reallocating among different narratives and tracks, usually showing some sectors relatively strengthening in price while others weaken.
What are the three most important indicators for tracking capital flows?
Focus on on-chain TVL changes, exchange funding rates and open interest, and stablecoin net inflows, cross-validating them to reduce misjudgment.
What are the leading signals for DeFi sector rotation?
Expansion of DEX trading volume, changes in lending rates and utilization, rising governance token staking ratios, etc.
What are the main differences between Layer2 and Meme sector rotation signals?
Layer2 relies more on on-chain transaction volume, Gas fees, and TVL migration; Meme relies more on social sentiment and funding rate extremes, with greater volatility.
How should ordinary investors use rotation signals?
Build a multi-indicator monitoring panel, set risk management rules, avoid chasing rallies and selling dips based on a single narrative, and consider trading costs and impermanent loss.
Related Terms
Ready to try? Test the strategy on MSX with small positions. Educational content only — not investment advice.