Tokenization Policy Window Identification and Quantification: A Study of Window Width and Market Response Driven by Global Regulatory Events (2026)
Study of tokenization policy windows driven by regulatory events: event classification, window width, and data gaps. Not investment advice.
#Tokenization Policy Window Identification and Quantification: A Study of Window Width and Market Response Driven by Global Regulatory Events (2026)
⚠ This article is multi-asset digital asset research and does not constitute investment advice. Investing involves risk; please make decisions prudently.
Core conclusion: Tokenization policy windows can be identified by mapping regulatory events on a timeline and using event study methods, but quantifying window width and market response highly depends on reliable event samples and price data. At present, data gaps and classification subjectivity still exist.
#Underlying/Business Line Definition
This research belongs to tokenization regulation and RWA policy research. The research object is the impact window of global regulatory events (legislation, enforcement, guidance) on tokenized asset markets, rather than a single trading instrument. Tokenized assets include tokenized stocks, RWAs (real-world assets), etc. Taking tokenized stocks as an example, they are digital assets that represent exposure to the price of specific stocks. Trading the token does not equal holding the actual stock; according to public disclosures, most tokenized stock products do not carry dividend or voting rights, but this depends on the issuance terms (as of the time of writing). The boundary of this research is to identify time windows before and after regulatory events and quantify market response, without providing buy or sell recommendations for specific instruments.
#Key Mechanisms and Data
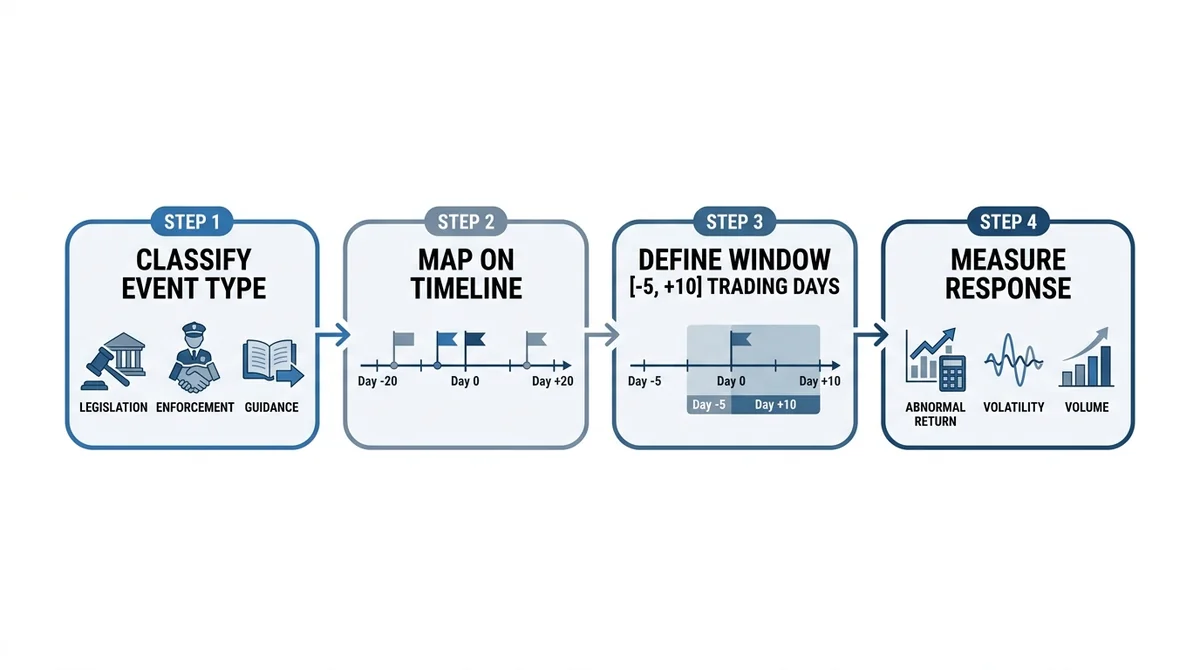
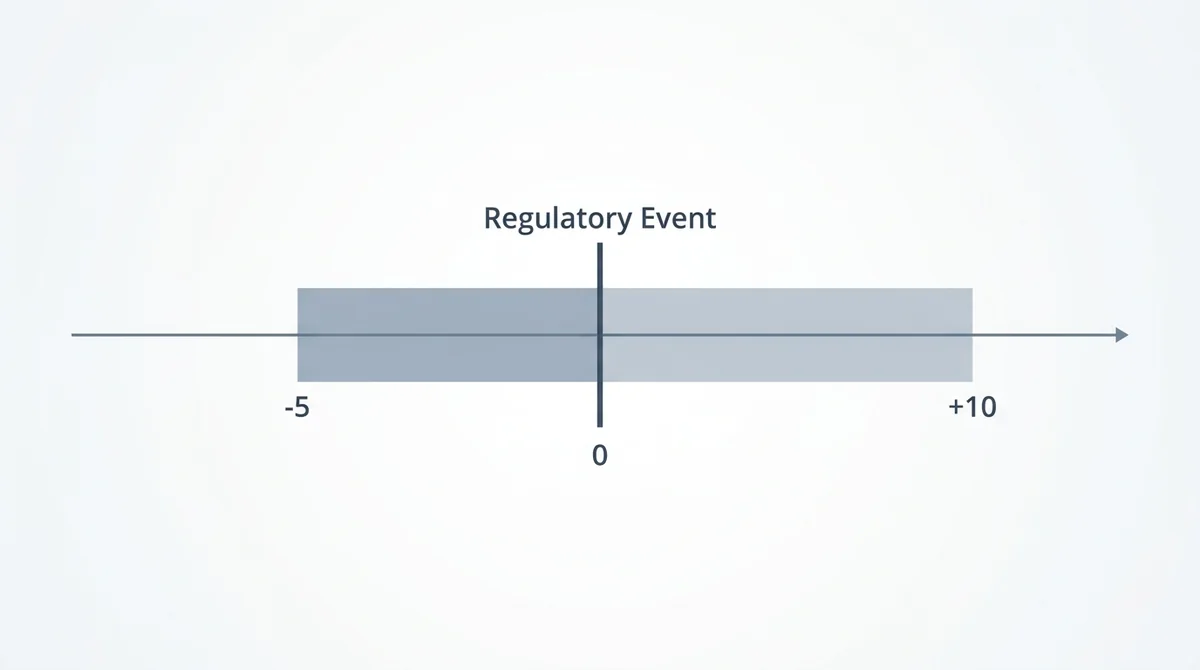
Event encoding mechanism: Classify regulatory events by type (legislation, enforcement, guidance) and map them onto a timeline, defining an observation interval before and after the event (e.g., [-5, +10] trading days) as the policy window period.
Quantification method: Use event study methodology, with abnormal returns, volatility changes or volume changes within the window as market response indicators. Window width is usually measured in trading days or calendar days before and after the event. The specific width should be chosen based on event type, asset liquidity, and sample backtesting, not by directly applying a fixed interval.
Data requirements: Precise event dates, event type labels, affected asset classes, and corresponding time series price/volume data are required. Because the current research input does not disclose specific event samples and market data, this article does not provide specific values; any data cited later should include a source reminder, such as "data from public disclosure/market quotes, as of XXXX-XX."
#Core Drivers
Regulatory density increase: There are signs that global tokenization and RWA regulation is shifting from principle-based discussion to enforceable rules, and the density of policy events may increase; but this trend lacks a unified quantitative indicator and needs to be confirmed by tracking specific regulatory documents.
Market size sensitivity: If the scale of tokenized securities and RWA products continues to grow, market reactions to policy changes may become more significant; however, data on market-specific size and historical reactions are currently lacking.
Demand for quantitative tools: Research-oriented investors need systematic methods to measure policy shocks for risk management and scenario analysis.
Improved data availability: Improvements in the availability of on-chain data and high-frequency market data make window period measurement more technically feasible; however, data coverage, time zone, and cleaning standards still need to be described.
#Key Participants
Regulators: Securities and financial market regulators in major economies that issue legislation, enforcement actions, and guidance are key sources of policy events.
Tokenization issuers and platforms: They provide tokenized stocks, RWAs, and other products, and their business and market prices are directly affected by policy windows.
Market data and index providers: They provide price, volume, and volatility data, serving as infrastructure for quantitative research on window periods.
Research institutions and quantitative teams: They use event study methods to assess policy impact and drive methodological improvements.
(The above list is factual description only and does not constitute any recommendation of specific instruments.)
#Risks and Divergences
Data gaps: Undisclosed event samples or market data may make conclusions unreproducible or unverifiable.
Survivorship bias: Studying only events that were recorded and had significant impact while ignoring undisclosed or less impactful events may overestimate policy shocks.
Subjectivity in event classification: The boundaries among legislation, enforcement, and guidance are sometimes blurry, leading to inconsistent window delineation.
Multiple confounding factors: Market responses may be influenced by macroeconomic environment, liquidity, and other factors, making it difficult to fully attribute them to a single regulatory event.
Bearish view: Some argue that policy window research oversimplifies and ignores that markets may price in expectations in advance, potentially weakening tradeable signals.
#What to Watch Next
Build an event calendar: Track tokenization regulatory progress in major economies, systematically recording event types, dates, and affected asset classes.
Backtest validation: Test the stability of window width across different event types and asset classes using historical samples.
Indicator monitoring: Observe volatility and volume changes of RWA-related tokens before and after events to verify market response characteristics.
(This article does not provide specific event predictions, only lists dimensions that research should focus on.)
#FAQ
Q1: What is a tokenization policy window period?
A1: A tokenization policy window period refers to an observation interval before and after a regulatory event (legislation, enforcement, guidance) used to measure market response to that event.
Q2: How is window width quantified?
A2: It is usually measured by the number of trading days or calendar days before and after the event. The specific width depends on event type and asset liquidity, and the reasonable interval needs to be determined through backtesting; there is no uniform standard.
Q3: What indicators are used to measure market response?
A3: Common indicators include abnormal returns, volatility changes, and volume changes within the window period, but attention must be paid to data frequency and time zone handling; on-chain holdings and capital flows can be supplementary, but not all tokenized assets have complete on-chain data.
Q4: What are the main limitations of current research?
A4: Main limitations include data gaps, survivorship bias, subjectivity in event classification, and attribution difficulties caused by multiple confounding factors; at this stage, conclusions should be regarded as framework-based rather than empirical.
Q5: How should ordinary investors use this research framework?
A5: It can be used as a thinking framework for understanding policy risk transmission, but should not be used to make direct investment decisions when data and validation are insufficient; any conclusion should be based on verified public data and independent judgment.
FAQ
What is a tokenization policy window period?
A tokenization policy window period refers to an observation interval before and after a regulatory event (legislation, enforcement, guidance) used to measure market response to that event.
How is window width quantified?
It is usually measured by the number of trading days or calendar days before and after the event. The specific width depends on event type and asset liquidity, and the reasonable interval needs to be determined through backtesting; there is no uniform standard.
What indicators are used to measure market response?
Common indicators include abnormal returns, volatility changes, and volume changes within the window period, but attention must be paid to data frequency and time zone handling; on-chain holdings and capital flows can be supplementary, but not all tokenized assets have complete on-chain data.
What are the main limitations of current research?
Main limitations include data gaps, survivorship bias, subjectivity in event classification, and attribution difficulties caused by multiple confounding factors; at this stage, conclusions should be regarded as framework-based rather than empirical.
How should ordinary investors use this research framework?
It can be used as a thinking framework for understanding policy risk transmission, but should not be used to make direct investment decisions when data and validation are insufficient; any conclusion should be based on verified public data and independent judgment.
Related Terms
Ready to try? Test the strategy on MSX with small positions. Educational content only — not investment advice.