Technical Pattern Study: Wedge Breakout Confirmation Signals, Failure Cases, and Application in the AI Computing Power Sector
Wedge breakout confirmation, failure cases, trend/range applicability, CMF neckline, and AI computing risk management. Not investment advice.
⚠ This article is U.S. stock/industry research and does not constitute investment advice. Investing involves risks; please assess on your own.
In the AI computing power sector, technical analysis tradition holds that an effective wedge breakout confirmation generally requires price to break the pattern boundary on higher volume; breakout signals in trending environments tend to have relatively higher empirical success rates, but any pattern has a probability of failure, so stop-losses must be set.
#Core Conclusion
Core Conclusion: A wedge breakout is not a standalone trading signal; it needs to be filtered with volume, capital flow (e.g., CMF), and market environment. According to general experience in technical analysis, breakout validity tends to be higher in trending markets, while false breakouts are more common in rangebound markets; however, this conclusion lacks rigorous statistical evidence and should be treated as a heuristic rule. The claim that high volatility in the AI computing power sector increases the frequency of wedge patterns during acceleration phases is mainly based on hindsight observation; pattern failures can also bring rapid pullbacks.
#Sector/Theme Definition
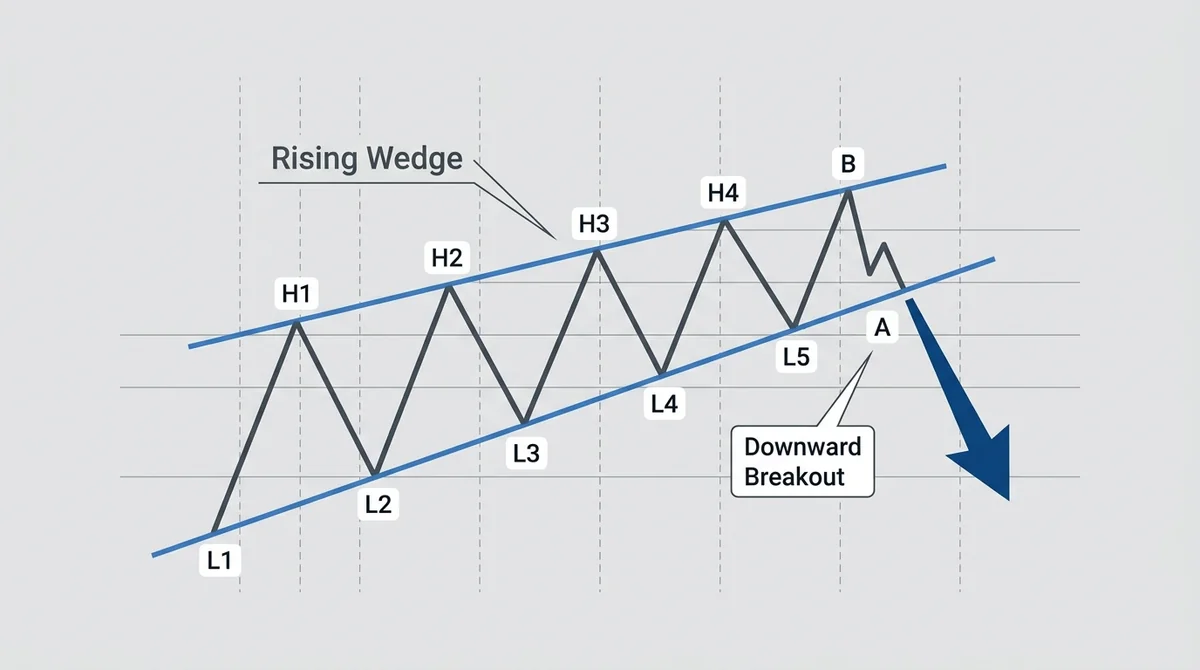
Research Scope: This article focuses on the 'wedge pattern' in technical analysis—including rising wedges and falling wedges—covering breakout confirmation, failure cases, and their application in the AI computing power sector. The boundary of the AI computing power sector includes GPU/accelerator design, wafer foundry, semiconductor equipment, servers/ODMs, and AI infrastructure spending by large cloud providers. Technical pattern research is only for auxiliary analysis and does not constitute a promise of returns.
#Key Data and Current Status
Data Source Reminder: Company financial data mentioned in this section (revenue, capital expenditure, etc.) should be checked against each company's latest public financial reports or disclosures; statistical regularities of technical patterns come from historical price behavior and do not represent future results. The technical pattern regularities below are all empirical rules and have not been systematically backtested.
#Confirmation Signals for Wedge Breakouts
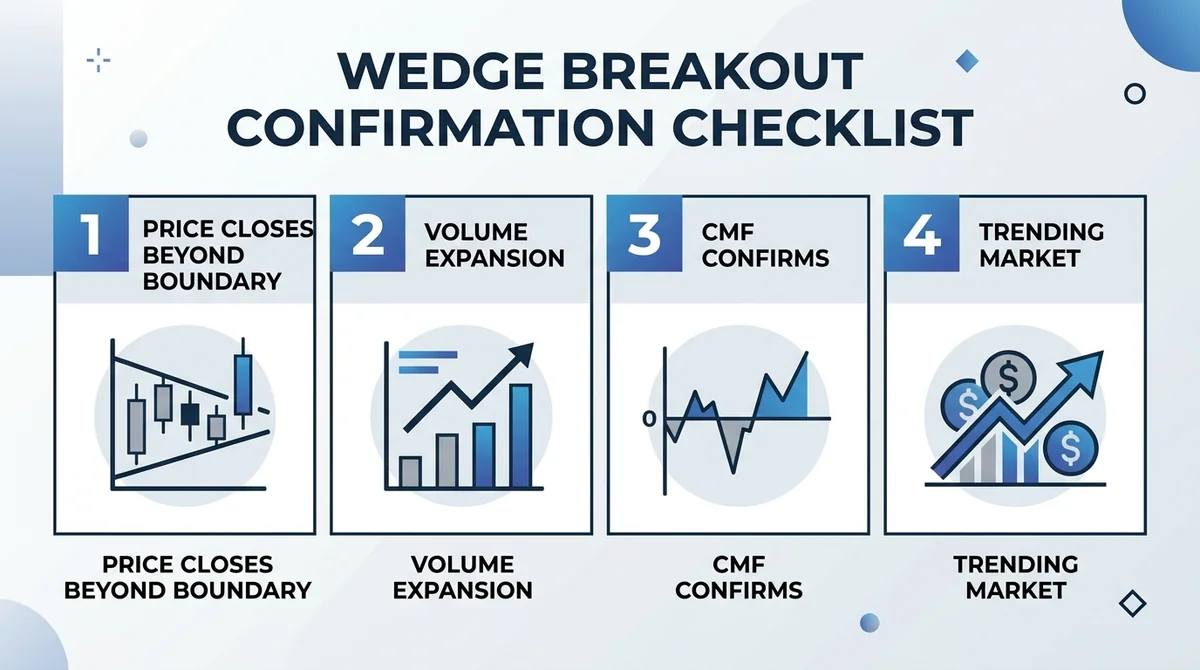
Confirmation Signal: Technical analysis generally holds that a wedge breakout requires price to close beyond the pattern boundary, accompanied by an increase in volume. When a rising wedge breaks to the downside, higher volume helps confirm; when a falling wedge breaks to the upside, new capital inflows are also needed (source: Investopedia). However, note that volume expansion is not an absolute necessity; a breakout on low volume may still be valid, just with a lower probability. Rising Wedge and Falling Wedge: A rising wedge is generally considered a bearish pattern, and a falling wedge is generally considered a bullish pattern; but this is general experience with many exceptions. Role of Volume: Volume is one common reference for breakout confirmation; a breakout lacking volume expansion tends more toward a false signal, but volume alone cannot determine it. Identifying False Signals: A price that quickly moves back inside the pattern after the breakout, persistently shrinking volume, or an overly shallow angle at the end of the pattern are often seen as warning signs of a false breakout, but they are not definitive.
#Failure Cases of Wedge Breakouts
Common Failure Traits: Based on empirical observation, failure cases often show insufficient volume after the breakout, with price falling back inside the pattern within a few days; or technical indicator divergence at the breakout (e.g., price makes a new high but CMF or RSI fails to confirm). However, these features are not present in every failure case, and survivorship bias may exist. Indicator Divergence: When price breaks the pattern boundary but indicators such as the Relative Strength Index (RSI) or CMF do not strengthen in tandem, the validity of the breakout is questionable; divergence can serve as a warning but cannot be the sole basis for a decision. Volume Contraction: If volume on the breakout day and the following days remains consistently below the average volume during the pattern's formation, it indicates insufficient market participation and a higher failure probability; however, the definition of 'average volume' and parameter choices can affect judgment.
#Breakout Strategy: Better for Trending or Rangebound Markets?
Trending Market: According to trading experience, when the trend is clear, breakout signals tend to align with the existing direction and have higher validity; a bullish breakout in an uptrend (such as a falling wedge breaking upward) is more likely to continue. But actual results depend on the trend definition and sample period. Rangebound Market: Price repeatedly crosses the boundary within a range, producing frequent breakout signals with a high failure rate, easily leading to repeated 'false breakout — stop-loss — re-breakout' churn; this is a common phenomenon but lacks rigorous statistics. Signal Filtering: You can use ADX to gauge trend strength and CMF to gauge capital flow, raising the confirmation threshold or reducing position size in rangebound markets; these indicators also have lag and parameter sensitivity and cannot eliminate risk.
#How to Judge the Neckline of a CMF Double Top?
CMF Indicator: CMF (Chaikin Money Flow) measures the strength of capital inflows and outflows over a period (source: StockCharts). In a double top pattern, when price breaks below the neckline, if CMF weakens simultaneously or has already formed bearish divergence, it is often interpreted as strengthening the reversal signal; but this is a technical analysis inference, not a confirmed causal relationship. Neckline Confirmation: The neckline is the horizontal line connecting the pullback lows between the two tops; a valid close below the neckline, accompanied by higher volume, is generally considered confirmation of the neckline break. The definition of a valid close (e.g., two consecutive daily closes below the neckline) should be specified in advance. Divergence Interpretation: If the second top has a higher price but lower CMF, it suggests weakening capital momentum and rising top risk; however, divergence can persist for a long time, and price may still continue upward.
#Application of Wedge Breakouts in the AI Computing Power Sector
Volatility Characteristics: The AI computing power sector is affected by cloud providers' capital expenditure guidance, chip supply-demand, and geopolitical policies, with historical volatility overall higher than the broader market, but specific periods and sample selection can affect conclusions. The claim that wedge patterns appear before accelerated rises or falls is mainly based on hindsight observation and suffers from selection bias. Individual Stocks/ETFs: Some high-beta AI computing power stocks and ETFs tracking semiconductor indices have shown rising wedge or falling wedge consolidations before sharp rises or falls, but this has not been systematically statistically verified; pattern quality varies greatly among different instruments and must be verified case by case. Fundamental Screening: Mechanically entering based on a wedge breakout is not prudent; it is recommended to combine industry prosperity (such as cloud providers' capex trends), company earnings guidance, and capital flow to screen for breakout candidates with fundamental support; but fundamental analysis also cannot guarantee returns.
#Core Drivers
Cloud Providers' Capital Expenditure: Large cloud providers' AI infrastructure investment is an important factor influencing AI computing power sector prosperity expectations, but it does not constitute a direct causal relationship; stock price reactions are also affected by expectation gaps and valuations. Semiconductor Cycle: Changes in chip supply-demand, inventory, and foundry utilization can amplify or dampen price trends, but the transmission path is complex and subject to time lags. Market Sentiment and Capital Flow: Crowded trades in the AI theme and rapid capital inflows/outflows may increase the frequency of technical patterns, but they are not the only cause. Technical Structure: The directional choice after volume-price convergence at the end of a pattern is often triggered jointly by fundamental and capital factors, but the direction is not always predictable.
#Key Companies in the Industry Chain
Upstream Chip Design: NVIDIA, AMD, etc. provide AI accelerators; Wafer Foundry: TSMC, etc.; Semiconductor Equipment: ASML, Applied Materials, etc.; Servers/ODMs: Supermicro, Dell, etc.; Cloud Providers: Microsoft, Google, Amazon, Meta are the main demand-side players. The above is only a factual listing of the industry chain and does not constitute any buy or sell recommendation. For specific company financial data, please refer to the latest public financial reports.
#Risks and Divergences
Probability of Pattern Failure: Any technical pattern has a probability of failure; a wedge breakout does not guarantee subsequent price movement. The specific failure rate is difficult to quantify precisely because it depends on parameters and samples. Stop-Loss Strategy: Breakout trading generally recommends setting a clear stop-loss, for example using the pattern boundary or the low/high of the breakout candle as a reference, and controlling position size per trade; however, setting a stop-loss does not guarantee avoiding losses, and slippage may cause actual losses to exceed the preset level. Limitations of Technical Analysis: Technical analysis is based on historical price behavior and cannot guarantee future returns; changes in market environment, sudden fundamental shifts, or liquidity shocks may cause patterns to fail.
#What to Watch Next
Earnings and Capex Guidance: Watch quarterly earnings from major cloud providers and AI chip companies, and next-year capital expenditure guidance. These events may affect volatility but do not necessarily produce tradeable wedge patterns. Macro and Liquidity: Federal Reserve rate path, changes in market risk appetite. Sector Technical Structure: Whether AI computing power-related indices/ETFs show new wedge patterns and volume confirmation. Event Calendar: Semiconductor equipment shipments, industry conferences, and policy developments (e.g., changes in export controls).
#FAQ
What are the confirmation signals for a wedge breakout?: Technical analysis generally holds that a valid close beyond the pattern boundary, accompanied by a significant increase in volume, is an important condition for breakout confirmation; but not all valid breakouts are accompanied by volume expansion, and other factors should be considered. How to identify a false breakout?: A price that quickly moves back inside the pattern after the breakout, volume that fails to sustain, and technical indicator divergence are often seen as warning signs of a false breakout, but they are not definitive judgments. **Are breakout strategies more suitable for trending or rangebound markets?
FAQ
楔形突破的确认信号有哪些?
技术分析中通常认为,价格有效收盘突破形态边界,且成交量显著放大,是突破确认的重要条件;但并非所有有效突破都伴随放量,需结合其他因素。
如何识别假突破?
突破后价格快速收回形态内、成交量未能持续、技术指标背离,常被视为假突破的警示信号,但不是确定性判断。
突破策略更适合趋势还是震荡市场?
根据交易经验,趋势市场中突破策略成功率相对更高;震荡市中假突破频繁。但实际效果受参数和市场环境影响,应结合 ADX、CMF 等过滤,不能保证收益。
CMF 双顶颈线如何判断?
价格跌破双顶颈线时,观察 CMF 是否同步走弱或出现顶背离;若成交量放大且 CMF 走弱,反转信号通常被认为增强,但背离可能持续。
在 AI 算力板块使用楔形突破有哪些风险?
高波动使形态失败回撤更快,且假突破可能更频繁;必须设置止损并控制仓位,技术形态只能作为辅助,不能替代基本面与风险管理。
Related Terms
Ready to try? Test the strategy on MSX with small positions. Educational content only — not investment advice.