Macro Drivers of Funding Rate Reversals and Perpetual Futures Timing Strategies: 2026 Crypto Market Research
Explains funding rate reversal signals, applicable environments, failure scenarios, and execution framework for macro-driven long/short switches.
#Macro Drivers of Funding Rate Reversals and Perpetual Futures Timing Strategies: 2026 Crypto Market Research
⚠ This article is a multi-asset digital asset research piece and does not constitute investment advice. Investing involves risk; please make prudent decisions.
Core conclusion: The funding rate is not a transaction fee but an anchoring cost paid between longs and shorts. When the funding rate retreats from extreme levels alongside confirmation from open interest and price, it often reflects a shift in long/short power in the derivatives market and can serve as a research signal for adjusting perpetual futures direction.
#Underlying/Business Line Definition
This study focuses on funding rate signals in the crypto asset perpetual futures market, not direct trading advice for spot, tokenized stocks, or RWA. The funding rate is a periodic cash flow exchanged between longs and shorts in perpetual futures, used to anchor the contract price to the spot price. When the rate is positive, longs pay shorts; when negative, shorts pay longs. Specific rate values vary by trading pair and exchange, and real-time market data should be checked during research. Data comes from public disclosures/market quotes.
#Key Mechanisms and Data
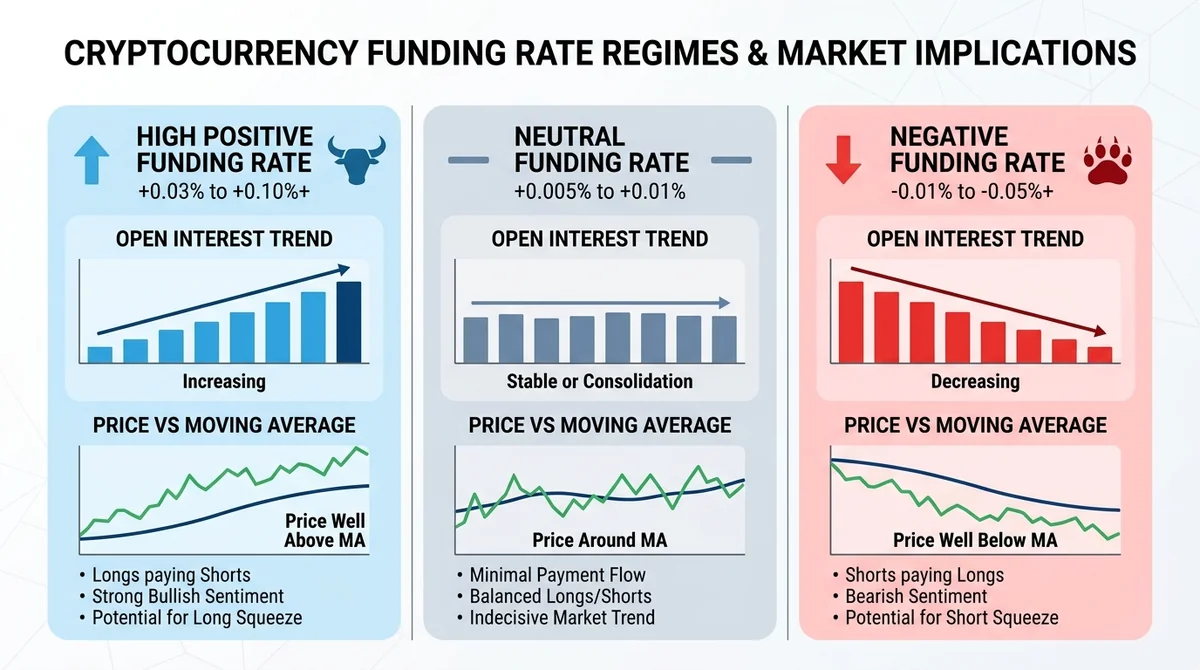
How does the funding rate reflect long/short power?
The funding rate can be viewed as a real-time thermometer of long/short balance in the derivatives market. Persistently positive and elevated rates usually mean crowded longs and leveraged bullishness; persistently negative rates reflect short dominance or shrinking market risk appetite. However, the rate itself is an outcome, not a cause, and must be judged together with open interest and price.
What is a "funding rate reversal" signal?
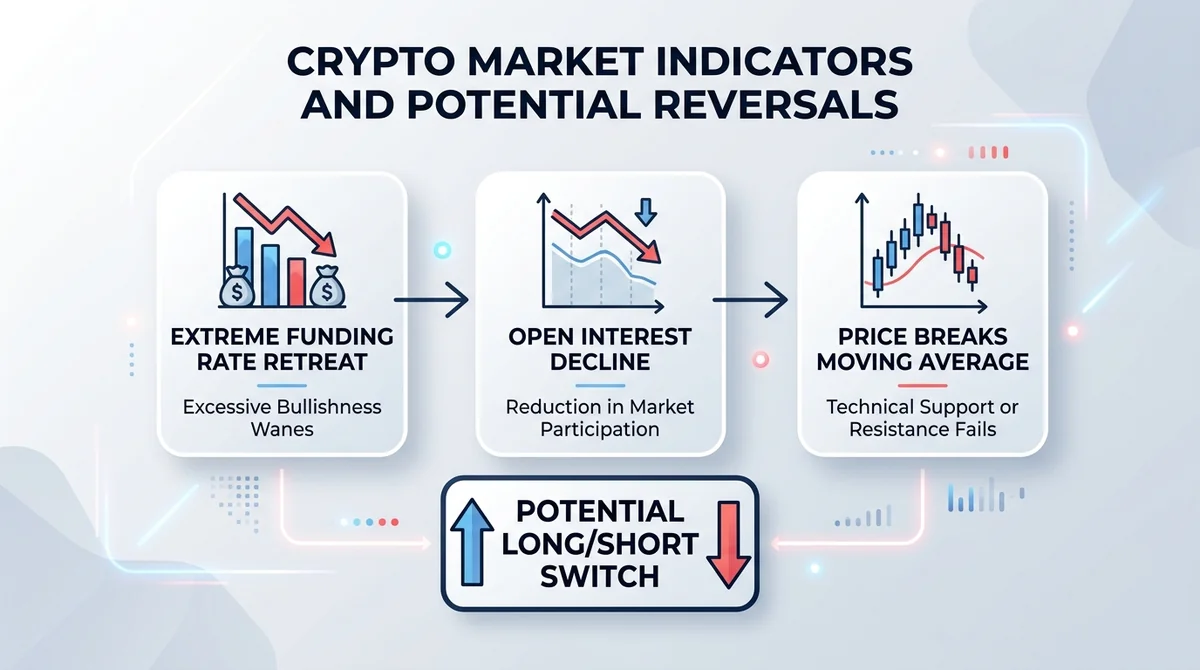
A "reversal" refers to the funding rate retreating from extreme positive territory to negative or neutral, especially when this retreat occurs alongside a decline in open interest. That often suggests previously crowded long positions are being closed or forced out. The signal does not always lead to a trend reversal; in certain market phases (such as ranging markets or early trends), it may have more reference value.
Why combine open interest and price confirmation?
A single funding rate signal can be disturbed by short-term noise. A decline in open interest (OI) plus a retreat in the funding rate usually corresponds to deleveraging; if price also breaks below a key moving average or support level, the evidence for a long/short switch is more complete. Looking only at the rate while ignoring price and open interest can easily mistake a pullback consolidation for a reversal.
#Core Drivers
How does the macro environment affect effectiveness?
A turning point in macro risk appetite—for example, slowing dollar liquidity tightening, a pause in the rate-hike cycle, or a rebound in risk-asset beta—is the most favorable research backdrop for this strategy. In such an environment, derivatives markets often show mean reversion after extremes first, giving funding rate reversals stronger leading significance.
Which volatility states match best?
Breakouts after volatility contraction are often accompanied by rapid adjustments in leveraged positions. One-sided bets accumulated during low-volatility phases tend to be unwound en masse at the breakout, causing the funding rate and price to turn in sync. Such resonance is more common near trend turning points and range boundaries.
What are the characteristics of trend turning points and range boundaries?
Range boundaries often show extreme funding rate values and periodic highs in open interest at the same time; trend turning points manifest as price structure breakdown and loss of key moving averages. When both resonate, signal quality is higher. However, if the market is in a strong one-way trend, the rate can remain extreme for a long time, and reversal signals tend to become blunted.
#Key Participants
- Perpetual futures exchanges: Provide the perpetual futures funding rate settlement schedule, liquidation rules, and depth. Different exchanges have different funding rate calculation intervals and upper/lower limits.
- Market makers and arbitrageurs: Through cross-exchange arbitrage and spot-futures arbitrage, they push the funding rate back toward a no-arbitrage range, serving as important maintainers of signal effectiveness.
- Macro traders and block traders: They establish directional positions based on changes in dollar liquidity and risk appetite, and their behavior often catalyzes funding rate reversals.
- Research-oriented readers: Use this signal as an observation dimension of derivatives market structure, not as standalone trading instructions.
For a more systematic approach to extreme-value quantiles, see 2026 Perpetual Futures Funding Rate Extreme Strategy Research: Historical Quantiles, Cross-Exchange Arbitrage, and Drawdown Control.
#Step-by-Step Execution Framework
Step 1: Identify the macro backdrop
Confirm whether overall risk appetite is turning, and watch dollar liquidity indicators, relative strength of major risk assets, and policy expectation changes. When the macro backdrop is unsupportive, the win rate of funding rate reversal signals tends to decline.
Step 2: Observe divergence between funding rate and open interest
Compare the funding rate quantile with open interest changes: if the rate retreats from highs while open interest declines in sync, deleveraging is underway; if open interest is still rising, it may be new shorts entering rather than longs closing.
Step 3: Price confirmation
Wait for price structure signals, such as a break below a key moving average, previous low, or range lower boundary. Before price confirmation, a funding rate reversal can only serve as a warning, not as a basis for entry.
Step 4: Position sizing and stop-loss
Use light positions for trial trades. Under risk management discipline, a single trade's risk is usually limited to within 1%–2% of total capital, which is a parameter choice rather than market data. Preset a fixed stop-loss; if price regains a key level or the funding rate turns positive again, consider exiting.
#Scenario Example: A Typical Funding Rate Reversal Trade
Assume a perpetual futures funding rate retreats from extreme highs to below neutral, open interest declines in sync, and price breaks below a key moving average. The strategy may consider trying a short when price rebounds to near a key resistance level, with the initial stop-loss set above that resistance or the recent high. If the judgment is wrong and price reclaims the moving average or the funding rate turns positive again, an exit is triggered. This scenario is a teaching hypothetical and does not constitute buy/sell advice for any specific instrument.
#Risks and Divergences
Funding rate signal failure in one-way trends
In strong one-way up or down moves, the funding rate may remain extremely positive (or negative) for a long time while price keeps trending. In such cases, reversal signals appear frequently but are mostly false, easily leading to consecutive stop-losses.
Gap risk driven by macro events
Sudden policy, regulatory, or liquidity events may cause price gaps, breaking the normal relationship between the funding rate and price and distorting the signal.
Rate distortion due to insufficient liquidity
Low-liquidity contracts have high funding rate volatility and noise, reducing the reference value of historical quantiles and making strategy performance unstable.
For details on liquidation cascades and funding rate transmission mechanisms, see 2026 Crypto Derivatives Market Structure Research: Perpetual Futures Funding Rate and Liquidation Cascade Risk Transmission.
#What to Watch Next
- Funding rate quantiles and positive/negative switching frequency for BTC/ETH perpetual futures on major exchanges.
- Weekly direction of open interest (OI) changes, especially the persistence of divergence with the funding rate.
- Volatility index states (such as DVOL and VIX-type indicators) to judge whether they are in late-stage contraction.
- Macro liquidity events: Fed policy signals, the U.S. dollar index, and major central bank balance sheet changes.
- On-chain derivatives liquidation data to see whether cascade liquidations resonate with funding rate reversals.
#FAQ
Q: What does a negative funding rate mean?
A: A negative funding rate means shorts pay longs, usually reflecting short-term bearish market sentiment or the disappearance of spot premium. However, the rate itself is an outcome; you must combine it with open interest and price structure to judge whether it represents a trend reversal.
Q: Is the funding rate reversal strategy applicable to the spot market?
A: The core signal of this strategy comes from the perpetual futures funding rate, and the spot market does not have this mechanism. Spot traders can use it as a market sentiment reference, but they cannot directly apply the funding rate signal for timing.
Q: Why can't I just look at the funding rate to open a position?
A: Because the rate can remain extreme for a long time, especially in strong one-way trends. Without price confirmation and macro backdrop filtering, relying solely on funding rate reversals can easily lead to frequent stop-losses.
Q: How can I control drawdowns in the funding rate reversal strategy?
A: Control leverage, use light trial positions, preset fixed stop-losses, and limit single-trade risk to 1%–2% of total capital. Avoid adding against the trend; wait for price structure confirmation before acting.
FAQ
What does a negative funding rate mean?
A negative funding rate means shorts pay longs, usually reflecting short-term bearish market sentiment or the disappearance of spot premium. However, the rate itself is an outcome; you must combine it with open interest and price structure to judge whether it represents a trend reversal.
Is the funding rate reversal strategy applicable to the spot market?
The core signal of this strategy comes from the perpetual futures funding rate, and the spot market does not have this mechanism. Spot traders can use it as a market sentiment reference, but they cannot directly apply the funding rate signal for timing.
Why can't I just look at the funding rate to open a position?
Because the rate can remain extreme for a long time, especially in strong one-way trends. Without price confirmation and macro backdrop filtering, relying solely on funding rate reversals can easily lead to frequent stop-losses.
How can I control drawdowns in the funding rate reversal strategy?
Control leverage, use light trial positions, preset fixed stop-losses, and limit single-trade risk to 1%–2% of total capital. Avoid adding against the trend; wait for price structure confirmation before acting.
Related Terms
Ready to try? Test the strategy on MSX with small positions. Educational content only — not investment advice.