2026 AI Compute Asset Pattern Breakout & Volume Anomaly Research: Long/Short Ratio, On-Chain Activity, and False Breakout Identification Mechanism
Learn to detect AI compute token fake breakouts using order flow imbalance, perp funding rates, long/short ratios, and on-chain activity metrics.
⚠ This article is a research study on digital asset micro-market structures and does not constitute investment advice. Crypto assets are highly volatile, and derivatives trading carries significant leverage and liquidation risks. Please exercise caution.
Core Conclusion: Due to fragmented spot liquidity and heavily concentrated derivatives leverage, technical pattern breakouts in AI compute assets are highly vulnerable to fake breakouts induced by instantaneous liquidity sweeps. Relying solely on traditional candlestick patterns cannot confirm trend validity; traders must cross-validate with Order Flow Imbalance (OFI), perpetual futures long/short account ratios, and actual on-chain compute settlement activity.
#Risk Disclaimer & Core Conclusion: Why Are Fake Breakouts Prevalent in AI Compute Assets?
#Methodological Scope and Disclaimers
This study primarily covers decentralized compute network tokens, AI infrastructure protocol tokens, and their corresponding derivatives markets. The research focuses on micro-market structures and on-chain data cross-validation, without providing buy/sell recommendations for any asset. Technical architectures, token unlock schedules, and tokenomics vary across protocols; statistical patterns are subject to time-sensitivity and sample limitations.
#How Fragmented Liquidity and High Leverage Amplify Breakout Noise
Within the digital asset market, the AI compute sector exhibits distinct liquidity tiering characteristics:
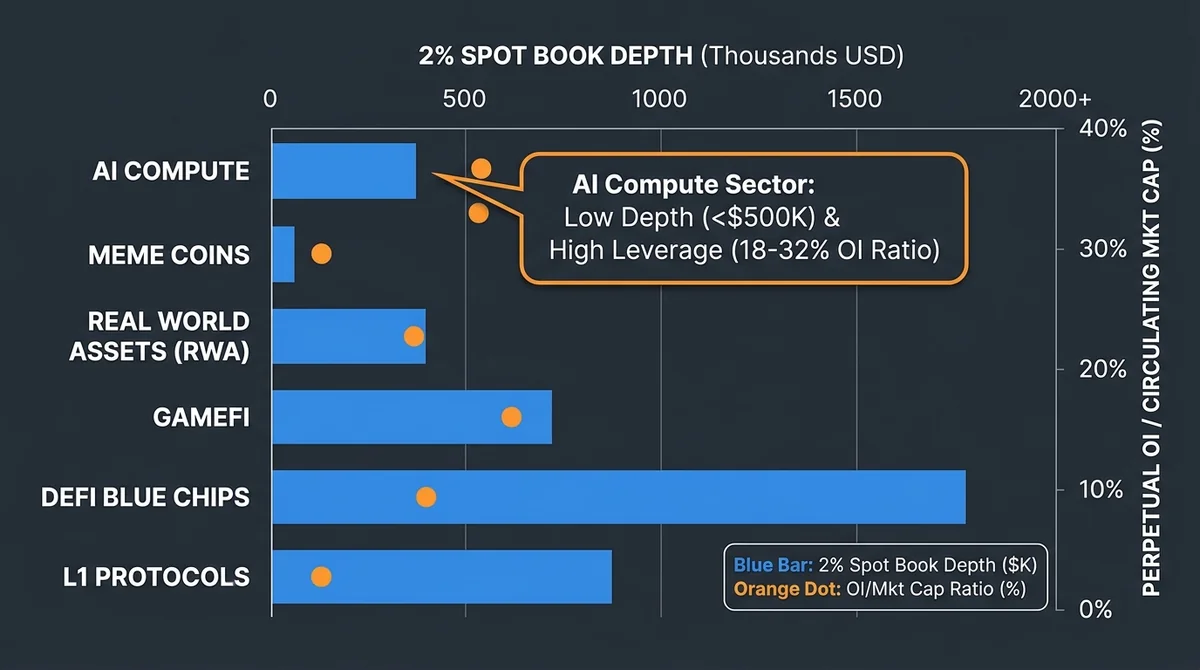
- Fragmented Spot Depth: For most small-to-mid-cap AI compute tokens, the 2% order book depth on a single centralized exchange is generally under $500,000 (based on sector liquidity observational samples). As a result, relatively small market orders can swiftly punch through key technical resistance levels.
- Over-Concentration of Derivatives Leverage: In several mid-cap compute protocols, the ratio of perpetual futures Open Interest (OI) to circulating spot market cap consistently hovers between 18% and 32% (industry sample estimates; variances exist across tokens).
Under this "high leverage, shallow depth" micro-structure, market makers and high-frequency algorithms frequently trigger long breakout chasers and short stop-losses above key resistance (Liquidity Sweeps), causing prices to briefly pierce resistance before rapidly reversing downward. The statistical win rate of classical chart patterns diminishes noticeably in illiquid assets.
#Wedge Breakouts & Volume-Price Validation: Detecting Fakeouts via Order Flow Imbalance
#Volume Threshold Criteria for Ascending/Descending Wedge Breakouts
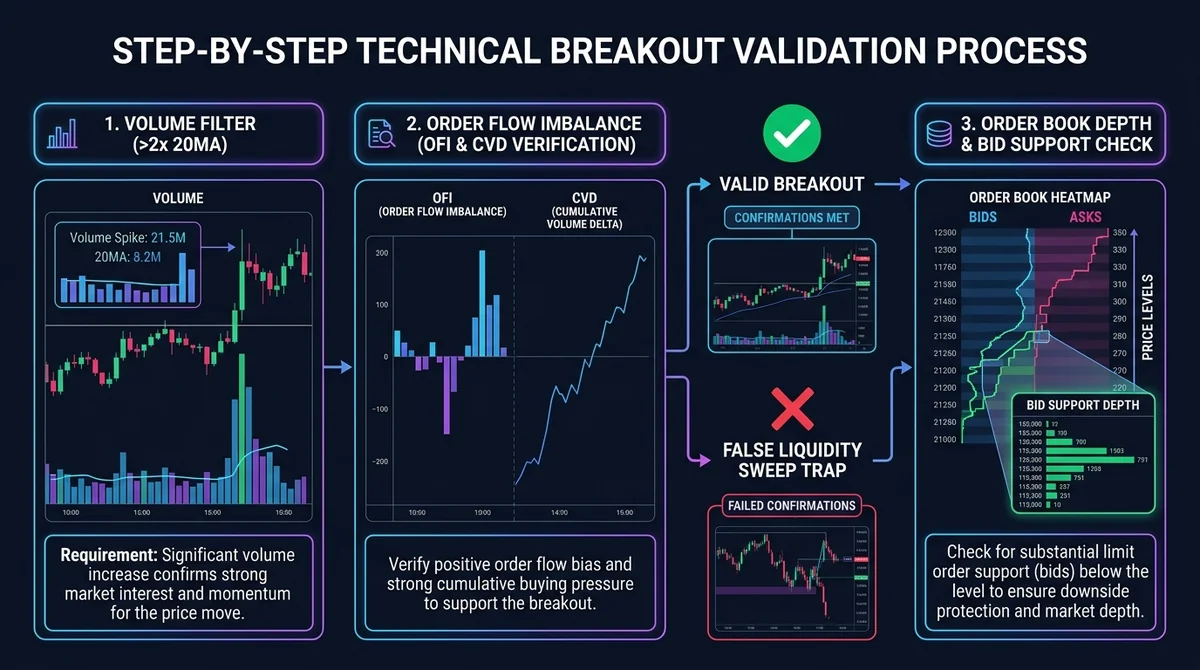
Wedge consolidations are common chart patterns in AI compute assets. When evaluating breakout validity, merely observing a candlestick close above the resistance trendline often leads into liquidity traps. In quantitative backtesting and empirical frameworks, a valid wedge breakout typically requires: the breakout candlestick volume (on a 4-hour or daily timeframe) must exceed 2x the 20-period moving average volume, and the subsequent two candles must not form bearish engulfing patterns. For detailed parametric derivations of chart patterns, refer to Technical Pattern Research: Wedge Breakout Confirmation Signals, Failed Cases, and Applications in AI Compute Tokens.
#Role of Order Flow Imbalance (OFI) at Key Price Levels
Order Flow Imbalance (OFI) quantifies the aggressive intent of buyers and sellers within the top 5 levels of the order book. During a true breakout, the Cumulative Volume Delta (CVD) trends upward in tandem with price, and bid depth builds solid support immediately below the breakout level (Bid Replenishment). If price prints a new high while CVD diverges downward, it indicates that the breakout was merely driven by passive fills or order cancellations, lacking sustained aggressive market buying.
#Typical Order Spoofing and Absorption Signatures in Fake Breakouts
Typical Fakeout Scenario: As price approaches critical resistance, sellers place large non-genuine limit orders above the market (Spoofing) to lure breakout momentum strategies into buying at market; these large limit orders then passively absorb the long liquidity and immediately cancel the underlying bids once filled, causing price to collapse rapidly in the absence of bid support.
| Verification Dimension | True Breakout Characteristics | Fake Breakout Characteristics |
|---|---|---|
| Volume | Expands on breakout and steadily increases with the trend | Single-bar volume spike, followed by rapid contraction |
| Cumulative Volume Delta (CVD) | Sustained net buying, trending up alongside price highs | Price pushes higher while CVD remains flat or diverges downward |
| Order Flow Imbalance (OFI) | Dense bid replenishment below the breakout level | Bids cancel rapidly after filling large asks above resistance, creating a liquidity vacuum below |
#Derivatives Game Theory: Long/Short Ratios and Funding Rates as Falsification Tools
#Liquidation Risks from Surging OI and Skewed Long/Short Ratios
Derivatives positioning data serves as a vital cross-validation dimension for spotting fake breakouts:
- Open Interest (OI) & Price Divergence: If perpetual futures OI surges by more than 25% (empirical monitoring threshold) during a breakout without corresponding net spot withdrawals from exchanges, the breakout is predominantly fueled by derivatives leverage.
- Top Trader Long/Short Account Imbalance: When the top trader long/short account ratio exceeds 2.4 or retail long positioning becomes excessively skewed, crowded long positioning significantly elevates the risk of a cascading liquidation. For an analysis of capital flows and liquidation transmission mechanisms, see 2026 Crypto Derivatives Market Structure Study: Perpetual Funding Rates and Liquidation Cascade Mechanics.
#Extreme Funding Rates, Basis Expansion, and Mean-Reversion Pressure
Understanding how does perpetual futures funding rate work is essential for evaluating long/short positioning costs. During a breakout, if funding rates spike to an annualized rate above 60% in a short window (note: annualized estimate under extreme market conditions), the carrying cost for long positions becomes unsustainable. Arbitrage capital will short perpetuals and purchase spot to capture the basis, exerting strong mean-reversion pressure on the spot price.
Breakout Triggered → Perp OI Surges + Funding Rate Spikes → Long Crowding Hits Critical Threshold
       ↓
Spot Buying Exhausts → Long Stop-Losses Triggered → Liquidation Cascade Occurs → Long Upper Wick (Fakeout)
#On-Chain and Fundamental Divergence: Can Real Network Compute Usage Support Breakouts?
#Correlation Between Decentralized Node Calls and Token Turnover Rates
The long-term valuation of AI compute assets hinges on actual compute supply and task execution (inference/training) calls across decentralized clusters. On a macro level, infrastructure trends are driven by broader enterprise capex cycles; see AI Compute Capex Cycle Study: Cloud Capex Guidance and Semiconductor Supply Chain Transmission for transmission paths.
On-Chain Verification Benchmark: When secondary market token turnover exceeds 40% in a single day, if active GPU node counts and task settlement contract calls (Compute Tasks Settled) on the decentralized protocol do not expand concurrently over a 7-day rolling window (e.g., growth rate significantly lagging turnover velocity), the breakout is more likely an internal liquidity rotation rather than fundamentally driven.
#Whale On-Chain Transfers and Exchange Net Inflows Dampening Breakout Momentum
Around breakout events, large whale transfers into centralized exchanges typically signal impending spot sell pressure. According to the analytical framework in 2026 Crypto Market On-Chain Metrics & Price Dynamics Study, when prices reach resistance zones while exchange net inflows spike into historically high percentiles (e.g., above the 90-day 85th percentile), the probability of the move turning into a fake breakout and returning to the range increases significantly.
#Conservative Rules for Undisclosed or Delayed Fundamental Data
Certain AI protocols utilize off-chain scheduling engines with delayed batch on-chain settlements, introducing latency into on-chain metrics. When compute utilization or protocol revenue is not verifiable on-chain in real time, quantitative trading models should apply a conservative discount, actively lowering the confidence weighting of breakout signals.
#Trading and Risk Management: Setting Risk Boundaries for AI Compute Breakouts
#Stop-Loss Placement and Time-Based Invalidation Rules After Breakout Failure
To protect against liquidity slippage during fake breakouts, risk management frameworks should enforce a dual defense mechanism:
- Price Stop-Loss: Place stop-loss orders at 1.5x ATR (Average True Range) below the pattern breakout neckline to avoid premature stop-outs from normal intraday volatility.
- Time-Based Stop-Loss: If the asset fails to print a new local high within 3 consecutive periods (e.g., 4-hour candles) post-breakout alongside declining volume, proactively trim risk exposure regardless of PnL.
#Position Sizing Models Against Liquidity Slippage and Liquidations
Given the instantaneous volatility of AI compute assets, risk exposure on a single breakout trade should not exceed 1.5% to 2.0% of total portfolio equity. On the derivatives front, effective leverage should be strictly capped between 2x and 3x to prevent sudden liquidity sweeps from breaching maintenance margin requirements.
#Right-Side Execution and Phased Entry Mechanism
Rather than aggressively market-buying directly at resistance levels, implement a three-stage phased entry model: "Right-side breakout → Low-volume retest of neckline confirming support → CVD turning positive again" (e.g., 30% initial position + 40% on retest confirmation + 30% on trend continuation), systematically reducing exposure to fake breakouts.
FAQ
Why are AI compute tokens more prone to fake breakouts than mainstream crypto assets?
AI compute tokens typically feature shallower spot liquidity and a higher ratio of perpetual futures Open Interest (OI) relative to their market cap. As price approaches key technical resistance, leveraged capital easily triggers short-term liquidity sweeps that quickly reverse without sustained fundamental buying, resulting in frequent fakeouts.
How does perpetual futures funding rate work to help identify fake breakouts?
When price breaks resistance, analyzing how does perpetual futures funding rate work becomes crucial: if funding rates abruptly spike to extreme annualized highs, it indicates crowded long leverage. This leaves the market vulnerable to liquidation cascades and cash-and-carry basis arbitrage, significantly increasing the probability of a fakeout.
How do on-chain compute usage metrics falsify technical chart breakouts?
By tracking the ratio of decentralized task settlement calls and active compute nodes relative to secondary market token turnover. If price breaks out on high trading volume but on-chain task executions remain flat or decline, the rally is primarily speculative and lacks underlying protocol demand, making it unsustainable.
What stop-loss rules are typically applied after a fake breakout occurs?
Traders typically combine a price-based stop-loss (placed 1.5x ATR below the breakout neckline) with a time-based stop-loss (proactively cutting positions if new highs are not formed within 3 analysis periods) to mitigate slippage and deep drawdowns caused by sudden liquidity drainage.
Related Terms
Ready to try? Test the strategy on MSX with small positions. Educational content only — not investment advice.