Pre-IPO and Tokenized Assets Weekly Recap: Disclosure Events, Valuation Anchoring, and Market Divergence Tracking (2026)
Weekly recap grades disclosure events and separates valuation bases: primary reference price, secondary trade price, and token price, tracking divergence signals and next-week risks.
⚠ This article is multi-asset research on digital assets and does not constitute investment advice. Investing carries risk; please make decisions prudently.
This week's recap of Pre-IPO and tokenized assets focuses not on price moves but on grading the materiality of disclosure events and distinguishing valuation bases: disclosure is the information input, price reaction is the outcome, and the two cannot be forcibly attributed after the fact. Note in advance: this article did not obtain the complete raw list of this week's events or quantitative market data, so the piece is primarily methodology and framework; any specific figures are marked as unverified, and readers should rely on the original documents from issuers and platforms.
#What disclosure events occurred this week in Pre-IPO and tokenized assets?
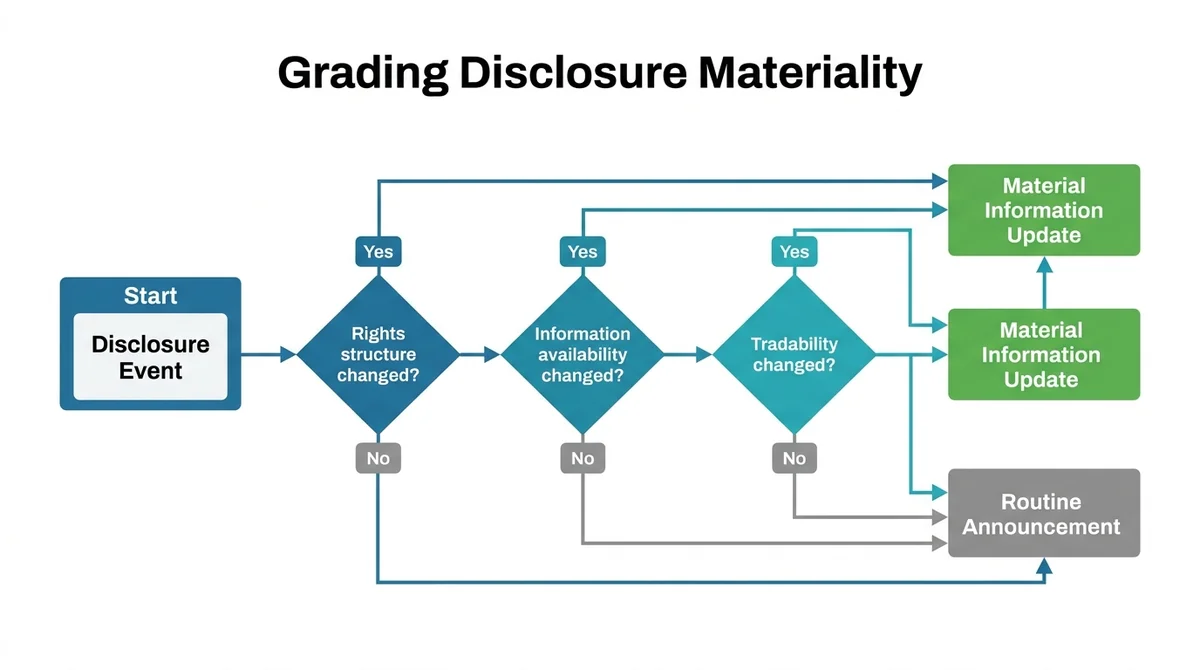
#Which disclosure events constitute material information updates?
The first task of the weekly report is to archive disclosure events by type, rather than treating every announcement as information of equal weight. Common classification categories include:
- Financing: new funding rounds, secondary share transfers, structural changes to convertible notes or SAFE-type instruments.
- Equity changes: employee option exercise windows, arrangements for existing shareholders to reduce holdings, cap table adjustments.
- Compliance filings: registration documents submitted to regulators, prospectus updates, application of exemption provisions.
- Platform announcements: launches, delistings, parameter adjustments, and changes to redemption arrangements for tokenized products.
Distinguishing material disclosures from routine announcements usually comes down to three criteria: whether it changes the rights structure (who holds how much and what rights they enjoy), whether it changes information availability (new verifiable financial or operating data), and whether it changes tradability (lock-up periods, redemption conditions, transfer restrictions). If none of the three is met, it is closer to a routine announcement.
It should be noted that the complete data for this week's specific event list has not been obtained; this article does not substitute speculative events for original disclosures, and readers should rely on the original documents from issuers and platforms.
#What is the relationship between disclosure events and token price volatility?
Disclosure is the information input; price reaction is the outcome. A more robust research approach is to record the two separately: first record the timing, type, and content of the disclosure, then separately record changes in price and volume, rather than looking back for an announcement to explain a price move after the fact. The latter easily produces hindsight attribution bias, especially in thinly traded tokenized assets where price volatility may stem from trading depth rather than the information itself.
This relationship is a speculative framework, not a proven causal conclusion: correlation may exist between disclosure and price, but correlation is not causation, and variables such as liquidity, market-making depth, and synchronized market sentiment are missing in between.
#How should valuation anchoring for Pre-IPO and tokenized assets be viewed?
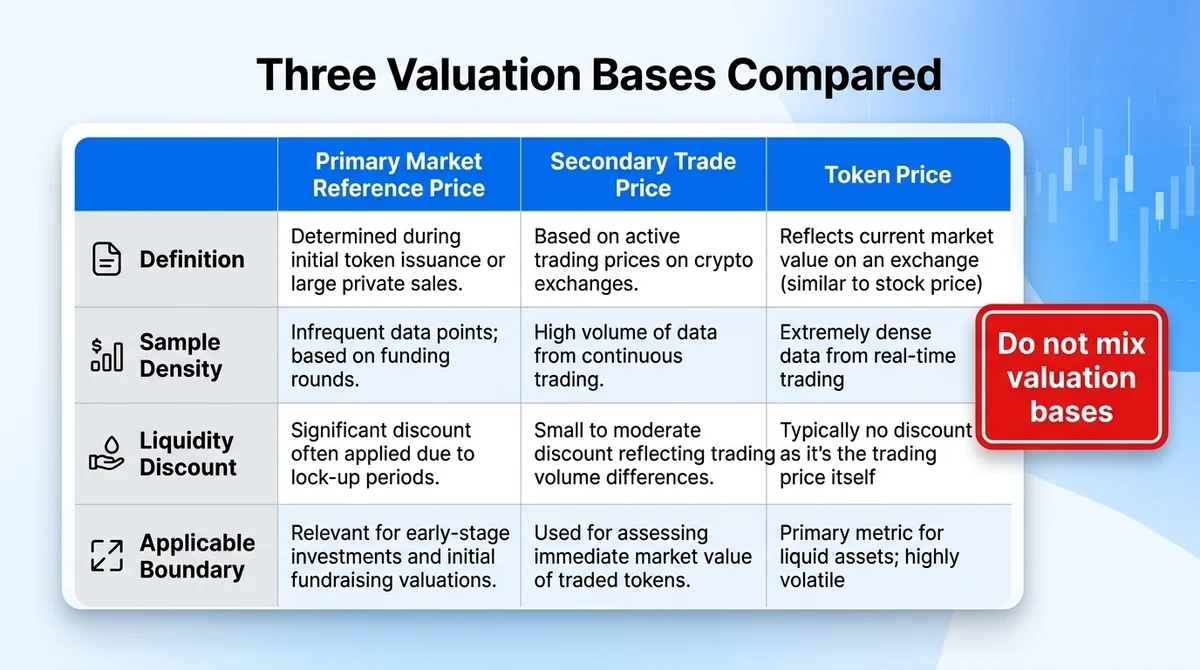
#What is the difference between primary market reference price, secondary trade price, and token price?
The three price bases have different applicable boundaries, and mixing them is the most common source of error in valuation discussions:
| Basis | Definition | Applicable boundary |
|---|---|---|
| Primary market reference price | Pricing from the most recent funding round or secondary share transfer | Reflects transactions at a specific point in time under specific terms, including liquidity discounts and preferential rights; not equal to fair value |
| Secondary trade price | Transfer transactions between existing shareholders | Sparse samples, opaque information; a single trade has limited representativeness |
| Token price | Quotes for tokenized products on-chain or on platforms | A mapping of price exposure, affected by liquidity, redemption mechanisms, and platform rules |
For tokenized stocks, the token price is the effect and the underlying price is the cause; the token provides price exposure, not a complete substitute for company rights. Specific spread and premium data should be based on public disclosures and market quotes; this article does not cite unverified figures.
#Why does valuation anchoring fail or lag?
Anchoring failure usually comes from three directions: first, insufficient liquidity, where price discovery is slow when trading is sparse and anchoring lag is more pronounced; second, term differences, where liquidation preferences and anti-dilution clauses in the primary market make reference prices and common stock value non-directly convertible; third, mechanism friction, where redemption windows, market-making depth, and trading-hour restrictions of tokenized products cause persistent deviations between token prices and underlying prices. These deviations are explanatory in mechanism research but do not constitute directional judgment; the magnitude and duration of deviations must be verified with actual order book data, and this article makes no quantitative assertions.
#Where is market divergence reflected this week, and how to track it?
#Which indicators can be used to observe divergence signals?
Trackable divergence signals include: spreads between different price bases (primary reference price vs. secondary trade price, token price vs. underlying price), volume changes (rising volume without price movement often means divergence is widening), and differences in disclosure completeness (among similar assets, some disclose regularly while others disclose very little).
#What does widening divergence mean, and what does it not mean?
Divergence is a state description, not a directional judgment. Widening divergence means the market's dispersion of value judgments on the same asset is increasing; it does not mean the price tends to move in a particular direction. Treating divergence as a basis for buying or selling is misusing a state indicator as a signal indicator. Specific indicator values have not been obtained, and this article does not provide quantitative thresholds.
#How should the performance of the tokenized asset sector be reviewed this week?
#Which dimensions should be examined in sector performance review?
The weekly report's sector review revolves around three dimensions: trading activity (direction of change in volume and turnover), price basis consistency (whether the deviation between token price and underlying price is converging), and event density (number and type distribution of disclosure events this week). These three dimensions describe market structure states, not up/down forecasts.
#Why does the weekly report only review and not forecast?
The weekly report is positioned as event review and sector performance record, and does not output price forecasts. The reason: the comparable historical data window for tokenized assets is short and samples are sparse, so any forecast based on short-term data lacks statistical support. Specific sector performance data has not been obtained; readers may refer to the methodology notes in our RWA market weekly and crypto spot market weekly, noting that the statistical bases for spot, perpetual futures, and tokenized assets are not the same.
#What events and risk points are worth watching next week?
#What types of events does next week's event calendar include?
The event calendar lists only timing and type, without conclusions. It typically includes: issuer earnings or operating data disclosure windows, regulatory filing submission or feedback milestones, parameter adjustments or changes to redemption arrangements for tokenized products, and macro data release times. Specific event times have not been obtained; refer to official announcements.
#What risks and uncertainties should be noted in advance?
- Disclosure delays: The information disclosure cadence of Pre-IPO assets is not bound by public market rules, and the delay itself is information.
- Liquidity changes: Declining market-making depth amplifies price deviations, especially when redemption windows are crowded.
- Inconsistent bases: Price and volume bases differ across platforms and products, and direct comparisons easily lead to wrong conclusions.
- Regulatory uncertainty: Jurisdictional recognition of tokenized securities, determination of securities attributes, and cross-border compliance requirements are still evolving; rule changes may alter product feasibility and exit paths.
- Derivatives distance: Perpetual futures on tokenized stocks are derivatives, further removed from the rights of actual shares; how does perpetual futures funding rate work and mark price mechanisms introduce additional variables—see our mechanism breakdown of perpetual mark price deviation and liquidation alerts.
#FAQ
Q1: Why is there no specific list of disclosure events in the weekly report? A: The complete list data for this week's events has not been obtained; this article does not substitute speculation for original disclosures, and readers should rely on the original documents from issuers and platforms.
Q2: Can the primary market reference price be used directly as a valuation? A: It should not be directly equated. The primary reference price includes liquidity discounts and preferential rights, and there is a structural difference between it and the fair value of common stock.
Q3: What does widening deviation between token price and underlying price indicate? A: It indicates rising friction between price bases, possibly from liquidity, redemption mechanisms, or trading-hour differences; it is a state description rather than a directional judgment.
Q4: Can divergence indicators be used for market timing? A: This article does not use them as a timing basis. Divergence is a state description, and misusing a state indicator as a signal indicator is a common methodological error.
Q5: Why does Pre-IPO research not make price forecasts? A: Pre-IPO is only a research topic; this article discusses only listing expectations, valuation methods, and risks, and does not make trading recommendations or price forecasts.
FAQ
Why is there no specific list of disclosure events in the weekly report?
The complete list data for this week's events has not been obtained; this article does not substitute speculation for original disclosures, and readers should rely on the original documents from issuers and platforms.
Can the primary market reference price be used directly as a valuation?
It should not be directly equated. The primary reference price includes liquidity discounts and preferential rights, and there is a structural difference between it and the fair value of common stock.
What does widening deviation between token price and underlying price indicate?
It indicates rising friction between price bases, possibly from liquidity, redemption mechanisms, or trading-hour differences; it is a state description rather than a directional judgment.
Can divergence indicators be used for market timing?
This article does not use them as a timing basis. Divergence is a state description, and misusing a state indicator as a signal indicator is a common methodological error.
Why does Pre-IPO research not make price forecasts?
Pre-IPO is only a research topic; this article discusses only listing expectations, valuation methods, and risks, and does not make trading recommendations or price forecasts.
Related Terms
Ready to try? Test the strategy on MSX with small positions. Educational content only — not investment advice.