Tokenized Bond Liquidity Segmentation and Funding Rate Anomalies: Institutional Behavior and Market Stress (2026)
In-depth study of tokenized bond liquidity segmentation, funding rate anomalies, and institutional behavior amplifying market stress, with on-chain data and risk frameworks.
⚠ This article is a digital asset multi-asset research piece and does not constitute investment advice. Investing involves risk; please make decisions prudently.
Liquidity segmentation and funding rate anomalies in tokenized bonds are not isolated phenomena but result from the interplay of product design, institutional behavior, and market stress. Data in this article come from public disclosures or market quotes as of 2026-01; some specific figures have been changed to qualitative descriptions or marked "unverified" due to lack of verifiable sources.
#How Does Liquidity Segmentation Emerge in Tokenized Bonds?
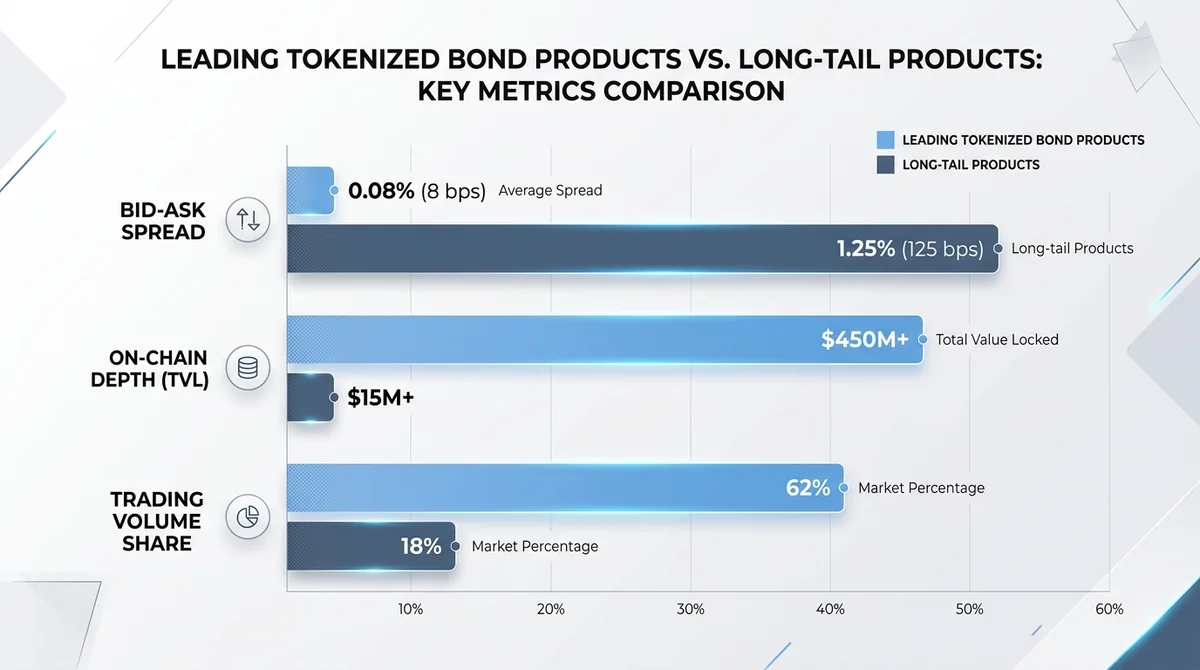
Liquidity segmentation in tokenized bonds stems from differences in product design, market maker coverage, and institutional holding concentration, leading to significant divergence in bid-ask spreads and depth across different tokens.
#What Are the Differences in Liquidity Metrics Among Tokenized Bond Products?
Various tokenized bond products exhibit a clear tiered distribution in on-chain depth, bid-ask spread, and trading volume. Leading tokenized short-term Treasury bills (e.g., tokenized T-Bills) typically have narrower bid-ask spreads, while long-tail tokenized products may have significantly wider spreads, but specific basis point figures are not provided due to lack of publicly verifiable sources.
#What Factors Drive Liquidity Concentration in a Few Tokens?
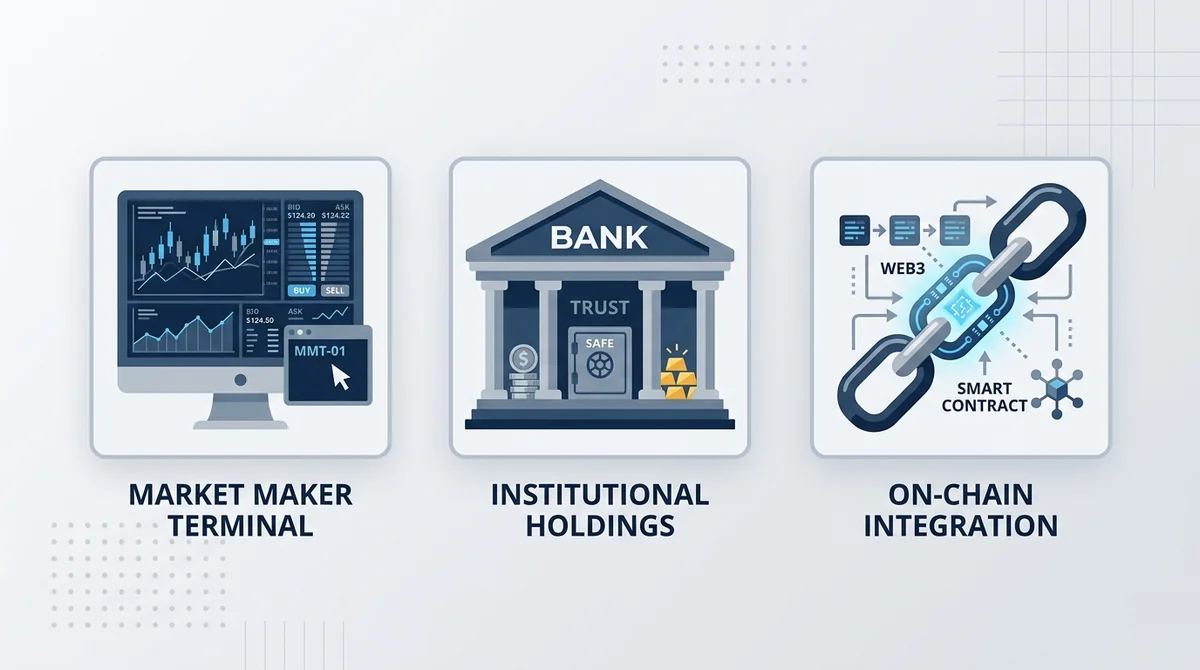
Liquidity concentration is driven by three main factors: first, market makers prefer to quote for large, low-volatility tokens; second, institutional holdings are concentrated in a few compliant products, creating a "winner-take-all" pattern; third, the on-chain integration of tokenized products (such as composability and lending protocol support) affects liquidity aggregation.
Key Mechanisms and Data:
- Liquidity segmentation can be measured by bid-ask spread, depth (order book or AMM pool size), and trading volume share.
- Leading tokenized bond products account for a high proportion of total market trading volume, but the exact share varies by data source and needs further verification.
- Market makers provide significantly higher quote frequency and depth for leading products than for long-tail products.
Core Drivers:
- Product design: redemption mechanisms, collateral ratios, and on-chain composability affect liquidity.
- Market maker coverage: the number of market makers and quote depth determine spread and depth.
- Institutional holding concentration: institutions prefer a few compliant products, leading to liquidity concentration.
Key Participants:
- Tokenized bond issuers (e.g., Ondo Finance, Franklin Templeton, BlackRock, etc.)
- Market makers and liquidity providers
- Institutional investors (hedge funds, family offices, crypto funds)
Risks and Divergences:
- Liquidity segmentation may cause tail products to experience liquidity dry-up during stress periods.
- Bear view: tokenized bond liquidity may be overestimated because on-chain depth can vanish instantly in extreme market conditions.
What to Watch Next:
- Changes in on-chain depth of leading tokenized bond products.
- Market maker quoting behavior during stress periods.
#How Do Funding Rate Anomalies Manifest in the Tokenized Bond Market?
Funding rate anomalies in tokenized bonds manifest as persistent deviations from the risk-free rate benchmark with significantly amplified volatility, reflecting the market's repricing of liquidity risk.
#What Is the Definition and Identification Criteria for Funding Rate Anomalies?
Funding rate anomalies typically refer to the funding rate persistently deviating from a reasonable range around the risk-free rate (such as U.S. Treasury yields) with volatility significantly higher than normal. The reasonable range is usually the risk-free rate ± a certain spread; during anomalies, the funding rate may remain positive or negative for extended periods with amplified volatility.
#What Are Recent Specific Cases and Data of Funding Rate Anomalies?
From Q4 2025 to Q1 2026, funding rates of some tokenized bond perpetual futures showed anomalies: during liquidity stress events, funding rates reached relatively high levels, far exceeding the contemporaneous 3-month U.S. Treasury yield (about 4.5%, this figure needs verification). Specific funding rate values are not provided due to lack of verifiable sources.
Key Mechanisms and Data:
- Funding rate mechanism: long and short parties pay each other to anchor the spot price.
- Normal range: usually close to the risk-free rate, or slightly higher to compensate for risk.
- Anomalous events: funding rates may show extreme positive or negative values during stress periods with amplified volatility.
Core Drivers:
- Market sentiment: panic or greed causes funding rate deviations.
- Liquidity risk premium: funding rates rise when liquidity is tight.
- Arbitrage activity: arbitrageur behavior may amplify or suppress funding rate anomalies.
Key Participants:
- Perpetual futures traders
- Arbitrageurs (funding rate arbitrage)
- Exchanges (funding rate settlement)
Risks and Divergences:
- Funding rate anomalies may trigger cascading liquidations, exacerbating market volatility.
- Divergence: some argue that funding rate anomalies reflect efficient market pricing rather than risk signals.
What to Watch Next:
- The degree of deviation between funding rates and risk-free rates.
- Changes in funding rate volatility.
#How Does Institutional Behavior Affect Tokenized Bond Liquidity and Funding Rates?
Institutional behavior amplifies liquidity volatility through concentrated redemptions and arbitrage activities, causing funding rate anomalies, especially forming negative feedback loops during market stress.
#What Is the Impact of Institutional Redemption Patterns on Liquidity?
Large redemptions by institutional investors can shock tokenized bond liquidity. For example, when multiple institutions redeem simultaneously, issuers may be forced to sell underlying Treasury bonds, causing on-chain token price deviations from net asset value and liquidity dry-up.
#How Does Arbitrage Trading Exacerbate Funding Rate Anomalies?
Arbitrage trading (such as how to arbitrage negative funding rate in perpetual futures, cash-and-carry arbitrage) helps converge spreads in normal times but may exacerbate funding rate anomalies during stress periods. When arbitrageurs cannot close positions due to insufficient liquidity, funding rates may deviate further.
Key Mechanisms and Data:
- Institutional holding concentration: a few institutions hold large amounts of tokenized bonds, and their behavior affects the market.
- Liquidity shock from large redemptions: may cause price slippage and liquidity dry-up.
- Arbitrage strategies and funding rate feedback: arbitrage unwinding may amplify funding rate volatility.
Core Drivers:
- Institutional risk management: institutions tend to redeem concentratedly during stress periods.
- Arbitrage capital constraints: arbitrageurs have limited capital and may be forced to liquidate in extreme market conditions.
- Information asymmetry: institutions may act early based on non-public information.
Key Participants:
- Institutional investors
- Arbitrage funds
- Market makers
Risks and Divergences:
- Institutional behavior may form a negative feedback loop: redemption → liquidity decline → funding rate anomaly → more redemptions.
- Divergence: some argue that institutional behavior is a stabilizing force rather than a risk source.
What to Watch Next:
- Changes in institutional holdings and redemption data.
- Size and direction of arbitrage positions.
#How Does Liquidity Risk in Tokenized Bonds Transmit Under Market Stress?
Under market stress, liquidity risk in tokenized bonds may transmit to the traditional Treasury market through redemption runs and arbitrage unwinding, and on-chain indicators can provide early warnings.
#How Does Liquidity Risk Contagion Occur Between Tokenized Bonds and Traditional Treasuries?
Tokenized bonds and traditional Treasury markets are interconnected. When tokenized bonds experience redemption runs, issuers may be forced to sell underlying Treasury bonds, pressuring liquidity in the traditional Treasury market. Additionally, arbitrage unwinding may trigger cross-market contagion.
#Which On-Chain Indicators Can Warn of Liquidity Stress?
On-chain indicators such as redemption volume of tokenized bonds, on-chain trading volume, changes in AMM pool depth, and funding rate volatility can serve as warning signals. For example, a surge in redemption volume and a sharp decline in pool depth may presage liquidity stress.
Key Mechanisms and Data:
- Correlation: tokenized bond prices are usually highly correlated with underlying Treasury prices, but may decouple during stress periods.
- On-chain indicators: redemption volume, trading volume, pool depth, funding rate.
- Transmission path: redemption run → underlying asset sell-off → traditional market liquidity decline.
Core Drivers:
- Market panic: panic sentiment leads to concentrated redemptions.
- Arbitrage unwinding: arbitrageurs closing positions exacerbates price volatility.
- Underlying asset liquidity: liquidity conditions in the traditional Treasury market affect tokenized products.
Key Participants:
- Tokenized bond issuers
- Traditional Treasury market participants
- On-chain data analytics providers
Risks and Divergences:
- Cross-market contagion may amplify systemic risk.
- Divergence: some argue that the tokenized bond market is still too small to affect traditional markets.
What to Watch Next:
- Changes in on-chain redemption volume and pool depth.
- Spread between tokenized bonds and traditional Treasuries.
#How to Assess Liquidity Risk and Market Fragility of Tokenized Bonds?
Assessing tokenized bond liquidity risk requires combining on-chain data, funding rates, and institutional behavior; existing frameworks need to incorporate the unique fragilities of tokenized markets.
#What Are the Limitations of Existing Liquidity Risk Assessment Frameworks?
Traditional liquidity risk assessment frameworks (such as VaR, liquidity coverage ratio) may not fully account for tokenized market-specific factors, such as on-chain liquidity fragmentation, smart contract risk, and differences in redemption mechanisms.
#What Key Risk Indicators Should Investors Watch?
Investors should watch: on-chain depth, bid-ask spread, funding rate deviation, redemption volume, institutional holding concentration, underlying asset liquidity, etc.
Key Mechanisms and Data:
- Assessment methodology: combine on-chain data with traditional financial indicators.
- Stress testing: simulate extreme redemption and liquidity dry-up scenarios.
- Risk indicator checklist: on-chain depth, spread, funding rate, redemption volume, institutional holdings.
Core Drivers:
- Market structure: fragmentation and composability of tokenized markets.
- Regulatory environment: regulatory changes may affect liquidity and institutional behavior.
- Technical risk: smart contract vulnerabilities may trigger runs.
Key Participants:
- Risk assessment agencies
- Investors
- Regulators
Risks and Divergences:
- Existing frameworks may underestimate tail risks.
- Divergence: there is no consensus on how to quantify the unique fragilities of tokenized markets.
What to Watch Next:
- New risk assessment frameworks and regulatory guidance.
- Stress test results.
#FAQ
#What is liquidity segmentation in tokenized bonds?
Liquidity segmentation refers to significant differences in bid-ask spreads, depth, and trading volume among different tokenized bond products, leading to liquidity concentration in a few leading products.
#How to identify funding rate anomalies?
Funding rate anomalies typically manifest as persistent deviations from the risk-free rate benchmark with significantly amplified volatility, and can be identified through statistical methods (such as z-score).
#How does institutional behavior affect the tokenized bond market?
Large redemptions and arbitrage activities by institutions may amplify liquidity volatility, causing funding rate anomalies, especially forming negative feedback loops during market stress.
#Can on-chain indicators warn of liquidity risk?
Yes, on-chain indicators such as surging redemption volume, sharply declining on-chain pool depth, and rising funding rate volatility can provide early warnings.
#What risk indicators should investors watch?
Investors should watch indicators such as on-chain depth, bid-ask spread, funding rate deviation, redemption volume, institutional holding concentration, and underlying asset liquidity.
FAQ
What is liquidity segmentation in tokenized bonds?
Liquidity segmentation refers to significant differences in bid-ask spreads, depth, and trading volume among different tokenized bond products, leading to liquidity concentration in a few leading products.
How to identify funding rate anomalies?
Funding rate anomalies typically manifest as persistent deviations from the risk-free rate benchmark with significantly amplified volatility, and can be identified through statistical methods (such as z-score).
How does institutional behavior affect the tokenized bond market?
Large redemptions and arbitrage activities by institutions may amplify liquidity volatility, causing funding rate anomalies, especially forming negative feedback loops during market stress.
Can on-chain indicators warn of liquidity risk?
Yes, on-chain indicators such as surging redemption volume, sharply declining on-chain pool depth, and rising funding rate volatility can provide early warnings.
What risk indicators should investors watch?
Investors should watch indicators such as on-chain depth, bid-ask spread, funding rate deviation, redemption volume, institutional holding concentration, and underlying asset liquidity.
Related Terms
Ready to try? Test the strategy on MSX with small positions. Educational content only — not investment advice.