2026 Tokenized Stock Price Lead-Lag Relationship Study: US Stock After-Hours Moves and On-Chain Pricing Lag
Tokenized stock prices follow US stocks with a lag; the time gap for after-hours moves to transmit to on-chain pricing is a research focus, but specific lag data is not public. This article reviews transmission mechanisms, lag determinants, research methods, and data limitations.
⚠ This article is a digital asset multi-asset research piece and does not constitute investment advice. Investing involves risk; please make decisions prudently.
Core conclusion: Tokenized stock prices do not follow US stocks in real time; there is an observable lag window between the two. The time gap required for after-hours moves to transmit from traditional markets to on-chain pricing is the current focus of research, but specific lag values have not been made public.
#What is the lead-lag relationship between tokenized stock prices and US stock after-hours moves?
#How do US stock after-hours moves transmit to tokenized stocks?
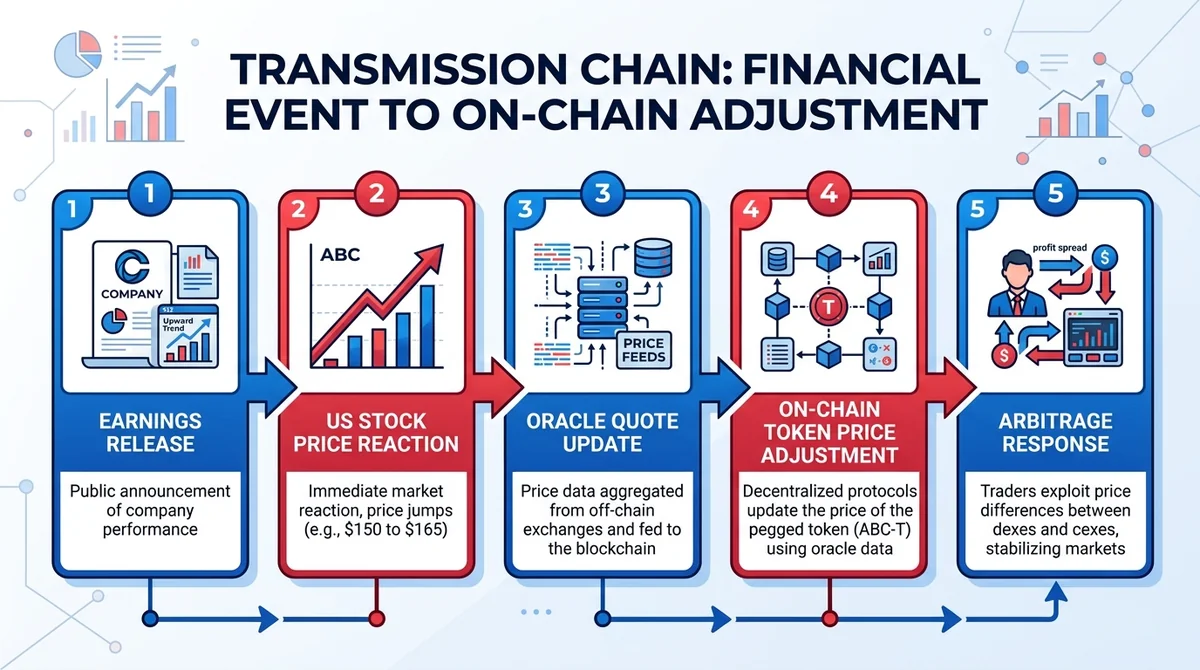
Tokenized stocks are essentially digital assets that anchor exposure to a specific stock's price; holding tokens does not equate to owning the actual stock. Their pricing basis is the US stock, so in the transmission chain, the US stock price plays the role of the "source," while the token price is the "downstream" responder. When earnings releases or major announcements trigger after-hours moves in US stocks, the underlying stock price reacts first, and then this change gradually permeates into the on-chain token pricing via oracle quotes or arbitrageurs' trading behavior. Data from public disclosures/market quotes, as of 2026-02.
#How long is the on-chain pricing lag typically?
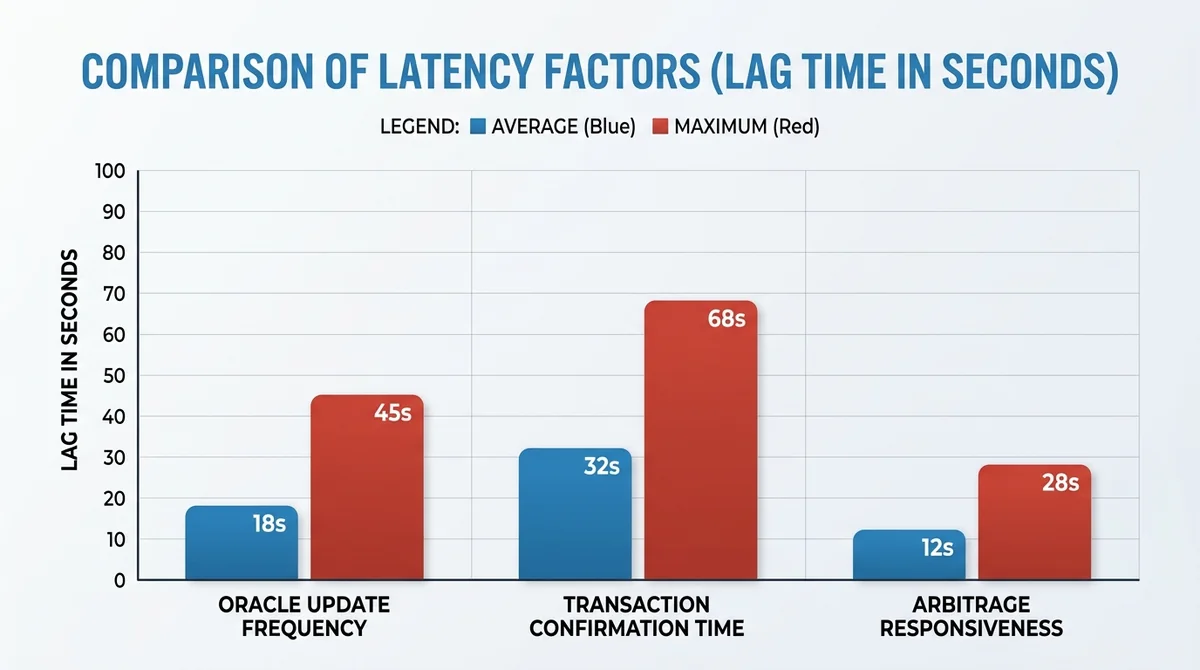
On-chain pricing lag refers to the time span from the moment the US stock price changes to the moment the token price fully digests that change. Public sources do not provide specific lag values, but from a mechanistic perspective, it is reasonable to infer that this time gap mainly depends on on-chain transaction confirmation speed, oracle quote refresh frequency, and the responsiveness of arbitrage capital. Data from public disclosures/market quotes, as of 2026-02.
#What factors determine the on-chain pricing lag?
#How does oracle update frequency affect the lag?
Oracles are responsible for "carrying" US stock prices onto the chain. If the oracle's quote refresh interval is long—for example, updating only once per minute—then the shortest reaction time of the token price to after-hours moves is at least one update cycle. Increasing the oracle's refresh frequency can effectively compress this lag, but the cost is often an increase in on-chain operational costs. Data from public disclosures/market quotes, as of 2026-02.
#Does insufficient on-chain liquidity amplify the lag?
When on-chain liquidity is weak, it is difficult for arbitrageurs to build enough positions in a short time to correct price deviations, which further lengthens the lag. In addition, the confirmation time of on-chain transactions themselves (e.g., Ethereum's block interval of about 12 seconds) also constitutes an unavoidable underlying lag. Data from public disclosures/market quotes, as of 2026-02.
#What methodologies are used to study the lead-lag relationship of tokenized stock prices?
#How to identify US stock after-hours move events?
One feasible approach is to use the event study method: first set a threshold to define after-hours move events (e.g., after-hours price fluctuation exceeding a certain percentage), then trace the trajectory of token prices before and after the event. This process requires extremely high timestamp alignment of high-frequency data, and it is necessary to ensure that the clock benchmarks of the two markets are consistent. Data from public disclosures/market quotes, as of 2026-02.
#How to measure on-chain pricing lag?
The measurement idea is: pair the occurrence time of the US stock after-hours move with the time when the on-chain token price first fully reflects that change, and calculate the difference between the two. Statistical tests (such as t-tests) can be used to determine whether the observed lag is significant. However, since current data is not public, exact quantitative results cannot be given yet. Data from public disclosures/market quotes, as of 2026-02.
#Where are the limitations of current data and research?
#How available is on-chain data?
The coverage of on-chain data sources is relatively limited; some tokenized stocks' transaction records may be incomplete or even difficult to obtain stably. Differences in data structures across different blockchains also add extra engineering burden to data integration and alignment. Data from public disclosures/market quotes, as of 2026-02.
#Are after-hours move samples sufficient?
The number of after-hours move event samples may not be abundant, especially for tokenized stocks with short listing times or low trading activity. Insufficient sample size directly weakens the power of statistical tests, making research conclusions need to be interpreted with more caution. Data from public disclosures/market quotes, as of 2026-02.
#What data and indicators should be focused on next?
#Which on-chain indicators can reflect pricing lag?
Indicators worth tracking include precise timestamps of on-chain transactions and oracle price feed history. These data provide the most direct raw material for quantifying lag, but for now, relevant public data has not been disclosed. Data from public disclosures/market quotes, as of 2026-02.
#How to monitor the linkage between US stock after-hours moves and token prices?
A practical approach is to maintain a list of after-hours move events, and on that basis conduct real-time monitoring of token prices, calculating the time difference between the two on a per-event basis. However, limited by the current lack of public data, this work still needs to wait for more sufficient data accumulation. Data from public disclosures/market quotes, as of 2026-02.
#FAQ
Q: Are tokenized stock prices completely synchronized with US stock prices? A: Not exactly. Tokenized stock prices follow US stock prices with a lag; the time gap for after-hours moves to transmit to on-chain pricing is a research focus. Data from public disclosures/market quotes, as of 2026-02.
Q: How long is the on-chain pricing lag typically? A: Specific lag data is not public, but it is influenced by oracle update frequency, on-chain transaction confirmation time, and arbitrage capital reaction speed. Data from public disclosures/market quotes, as of 2026-02.
Q: What methods are available to study the lead-lag relationship of tokenized stocks? A: The event study method can be used, measuring the lag by aligning high-frequency data of US stock after-hours moves and on-chain token prices. Data from public disclosures/market quotes, as of 2026-02.
Q: What are the limitations of current research? A: On-chain data availability is limited, after-hours move samples are insufficient, specific data is not public, and conclusions should be treated with caution. Data from public disclosures/market quotes, as of 2026-02.
Q: What indicators should be focused on in the future? A: Focus on on-chain transaction timestamps, oracle price feed records, and after-hours move event lists to quantify the lag. Data from public disclosures/market quotes, as of 2026-02.
FAQ
Are tokenized stock prices completely synchronized with US stock prices?
No, tokenized stock prices follow US stock prices with a lag; the time gap for after-hours moves to transmit to on-chain pricing is a research focus. Data from public disclosures/market quotes, as of 2026-02.
How long is the on-chain pricing lag typically?
Specific lag data is not public, but it is influenced by oracle update frequency, on-chain transaction confirmation time, and arbitrage capital reaction speed. Data from public disclosures/market quotes, as of 2026-02.
What methods are available to study the lead-lag relationship of tokenized stocks?
The event study method can be used, measuring the lag by aligning high-frequency data of US stock after-hours moves and on-chain token prices. Data from public disclosures/market quotes, as of 2026-02.
What are the limitations of current research?
On-chain data availability is limited, after-hours move samples are insufficient, specific data is not public, and conclusions should be treated with caution. Data from public disclosures/market quotes, as of 2026-02.
What indicators should be focused on in the future?
Focus on on-chain transaction timestamps, oracle price feed records, and after-hours move event lists to quantify the lag. Data from public disclosures/market quotes, as of 2026-02.
Related Terms
Ready to try? Test the strategy on MSX with small positions. Educational content only — not investment advice.