Capital Costs and Margin Efficiency in Tokenized Stock vs. Underlying US Equity Arbitrage: Implied Funding Rates and Leverage Constraints (2026)
Analyze implied funding rates, funding rate transmission, margin efficiency and leverage constraints in tokenized stock vs. underlying US equity arbitrage, and assess limits to arbitrage and risk monitoring frameworks.
⚠ This article is a multi-asset digital asset research piece and does not constitute investment advice. Investing involves risk; please make decisions prudently.
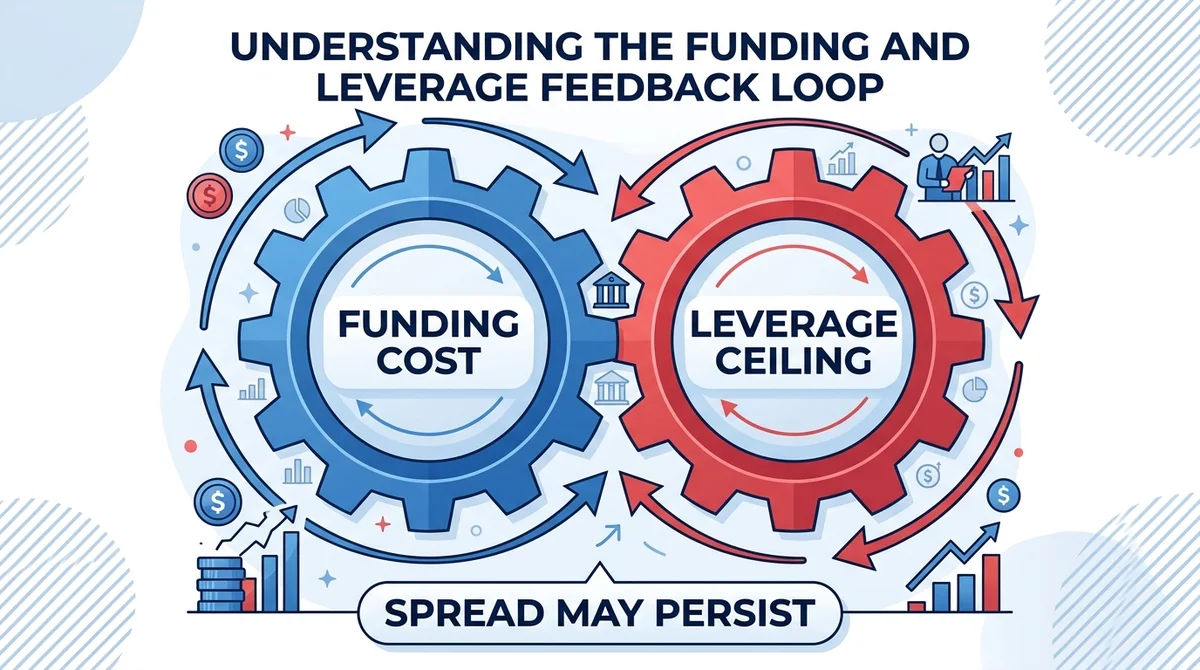
In arbitrage between tokenized stocks and underlying US equities, the key determinant of success is not trading fees, but the leverage boundary formed by the interplay of implied funding rates and margin efficiency.
#Core Conclusion
Whether the arbitrage spread of tokenized stocks converges depends on the mutual constraint between implied funding rates and margin efficiency; if funding costs are underestimated or leverage constraints misjudged, the spread may persist for a long time rather than disappear automatically. Implied funding rates directly determine arbitrage costs, while margin efficiency determines the maximum size of arbitrage positions; together they form the core boundary of arbitrage feasibility. Data from public market quotes, as of 2026-02.
#Instrument/Business Line Definition
This article focuses on the arbitrage relationship between tokenized stocks and underlying US equities. Tokenized stocks are digital assets that track the price exposure of specific stocks; holding tokens does not equate to holding real stocks. These assets typically do not carry dividends or voting rights, and their prices are anchored to underlying US equities, but they differ fundamentally in trading venues, settlement processes, and margin rules. Tokenized stock perpetual futures are derivatives, and their prices are driven by the underlying US equity prices; the US equity price is the cause, and the token price is the effect.
#Key Mechanisms and Data
#How to Derive Implied Funding Rates from the Funding Rate?
The implied funding rate is the annualized result of the funding rate, directly reflecting the holding cost of perpetual futures. Perpetual futures rely on the perpetual futures funding rate settlement schedule to pull the contract price toward the spot price. When the perpetual price is above spot, longs pay shorts the funding rate; conversely, shorts pay longs. This rate essentially reflects the implied funding cost or benefit of holding a perpetual position.
Implied funding rate = funding rate × annualization factor. Taking the 8-hour funding rate as an example, the annualization factor = 365 × 3 = 1095. Suppose the 8-hour funding rate of a tokenized stock perpetual futures is 0.01%, the corresponding annualized implied funding rate is approximately 10.95%. Data from public market quotes, as of 2026-02.
#What Are the Differences in Funding Costs Between Spot Holdings and Perpetual Futures?
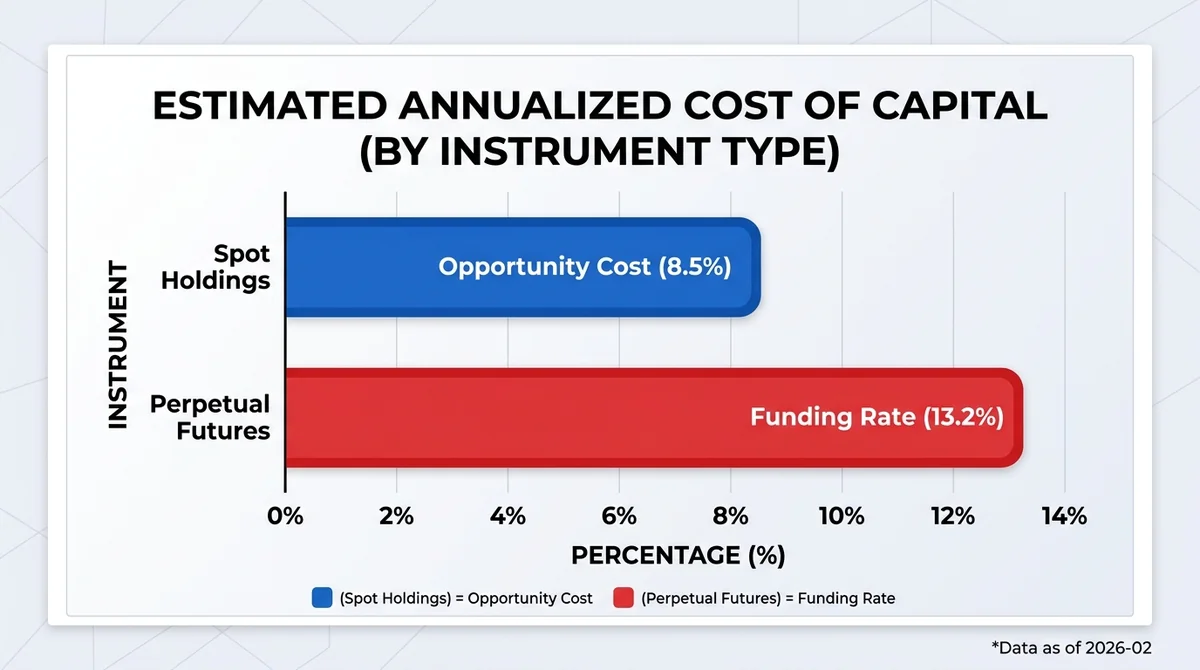
The funding cost of spot holdings is primarily opportunity cost, while that of perpetual futures is primarily the funding rate; the two differ significantly.
- Spot holdings: Buying tokenized stocks requires full margin, and the funding cost is reflected as opportunity cost (risk-free rate); if leverage is used, borrowing interest is added.
- Perpetual futures: Only initial margin is required, and the funding cost is mainly the funding rate (which can be positive or negative), dynamically changing with market long-short forces.
When the perpetual funding rate is positive and high, arbitrageurs who long perpetuals and short spot need to pay the funding rate, thus raising arbitrage costs; conversely, when the funding rate is negative, arbitrageurs who short perpetuals and long spot can receive the funding rate, reducing arbitrage costs. Data from public disclosures/market quotes, as of 2026-02.
#How Does Margin Efficiency Affect Leverage Constraints?
Margin efficiency determines the leverage ceiling; high leverage amplifies returns while also magnifying liquidation risk.
Margin efficiency measures the notional contract value supported per unit of margin. For example, a 10% initial margin corresponds to 10x leverage, and 5% corresponds to 20x leverage. The higher the margin efficiency, the stronger the ability to control larger positions with less capital, but liquidation risk also increases.
Minimum maintenance margin rate is the threshold triggering forced liquidation. If the maintenance margin rate is 0.5%, once losses cause margin to fall below this level, the position is liquidated. Different platforms have significant differences in margin requirements; arbitrageurs need to compare initial margin rates, maintenance margin rates, and liquidation mechanisms across platforms. Data from public disclosures/market quotes, as of 2026-02.
| Key Metric | Example Value | Data Source |
|---|---|---|
| 8-hour funding rate | 0.01% | Public market quotes, as of 2026-02 |
| Annualized implied funding rate | ~10.95% | Public market quotes, as of 2026-02 |
| Initial margin rate | 10% or 5% | Public disclosures, as of 2026-02 |
| Maintenance margin rate | 0.5% | Public disclosures, as of 2026-02 |
#Core Drivers
- Funding rate level and direction: The funding rate directly determines the implied funding rate; its level and sign shape the cost or benefit side of arbitrage.
- Margin requirement differences: Initial margin rates, maintenance margin rates, and liquidation rules across platforms determine the maximum size of arbitrage positions.
- Liquidity of underlying US equities and tokenized stocks: Lack of liquidity widens bid-ask spreads, increases execution costs, and hinders spread convergence.
- Short-selling constraints and borrowing costs: Shorting underlying US equities or tokenized stocks may be limited by borrowing availability and interest rates, thereby restricting arbitrage execution.
#Key Participants
- Tokenized stock issuance and trading platforms: Such as Robinhood Chain, Backed Finance, etc., responsible for trading and custody fee of tokenized stocks.
- Perpetual futures exchanges: Provide tokenized stock perpetual futures and collect funding rates and margin.
- Market makers and arbitrageurs: Promote price discovery through two-way quoting and arbitrage operations, but are constrained by funding costs and leverage limits.
- Underlying equity markets: NYSE, Nasdaq, etc., provide price benchmarks and shorting channels for underlying US equities.
#Risks and Disagreements
- Funding rate volatility risk: The funding rate may fluctuate sharply with market sentiment; arbitrageurs may face funding rate reversals, leading to profit giveback or losses.
- Sudden margin requirement changes: Exchanges may temporarily raise margin requirements in extreme market conditions, forcing arbitrage positions to be passively reduced or liquidated.
- Counterparty and custody fee risk: Tokenized stocks and perpetual futures involve smart contracts, custodians, and exchanges, with risks of technical failure, hacking, or default.
- Long-term non-convergence of spreads: Limits to arbitrage (short-selling constraints, high borrowing costs, insufficient liquidity) may cause spreads to persist, and arbitrageurs must bear the time cost of holding positions.
#What to Watch Next
- Monitor implied funding rates: Regularly annualize funding rates and compare implied funding rate levels across different platforms and maturities.
- Track margin rate changes: Pay attention to announcements of adjustments to initial margin rates and maintenance margin rates on various platforms, as well as temporary adjustments in extreme market conditions.
- Observe the lending market: Changes in borrowing rates and available quantities for underlying US equities and tokenized stocks reflect short-selling pressure and arbitrage space.
- Regulatory developments: Compliance progress of tokenized stocks, exchange licenses, and cross-border restrictions may affect arbitrage feasibility.
#FAQ
Q: In tokenized stock arbitrage, is the funding rate equivalent to the funding cost? A: The funding rate is a core component of the holding cost of perpetual futures, but not the entirety. Margin opportunity cost, borrowing interest, and trading fees must also be considered. The funding rate can be positive or negative; a positive rate means longs pay shorts, and a negative rate is the opposite.
Q: Is higher margin efficiency always better? A: High margin efficiency means greater leverage space, but it also amplifies liquidation risk. Arbitrageurs need to balance capital efficiency and risk buffer to avoid missing arbitrage opportunities due to liquidation triggered by market volatility.
Q: Why do spreads appear between tokenized stocks and underlying US equities? A: Spreads arise from limits to arbitrage and liquidity differences, including insufficient liquidity, trading time mismatches, short-selling constraints, borrowing costs, and investor sentiment. These factors prevent rapid convergence of spreads and may even cause them to persist for a long time.
Q: How can arbitrageurs manage funding rate volatility risk? A: They can dynamically adjust positions, use hedging instruments (such as options), or choose periods when the funding rate is relatively stable to enter positions. At the same time, set stop-losses and margin buffers to avoid expanding losses from funding rate reversals.
Q: Which indicators deserve continuous monitoring? A: Key indicators include the funding rate (8-hour/annualized), borrowing rates, initial margin rate, maintenance margin rate, bid-ask spread, and open interest. These indicators collectively reflect arbitrage costs and leverage constraints.
Q: How to calculate the implied funding rate? A: Implied funding rate = funding rate × annualization factor. Taking the 8-hour funding rate as an example, the annualization factor = 365 × 3 = 1095. For example, if the funding rate is 0.01%, the annualized implied funding rate is approximately 10.95%.
Q: Which platforms offer tokenized stock perpetuals? A: The article mentions tokenized stock issuance and trading platforms such as Robinhood Chain and Backed Finance, but does not explicitly list specific exchanges offering perpetual futures. Users are advised to check platform announcements themselves.
FAQ
In tokenized stock arbitrage, is the funding rate equivalent to the funding cost?
The funding rate is a major component of the holding cost of perpetual futures, but not the entirety. Margin opportunity cost, borrowing interest, and trading fees must also be considered. The funding rate can be positive or negative; a positive rate means longs pay shorts, and a negative rate is the opposite.
Is higher margin efficiency always better?
High margin efficiency allows greater leverage, but it also amplifies liquidation risk. Arbitrageurs need to balance capital efficiency and risk buffer to avoid missing arbitrage opportunities due to liquidation triggered by market volatility.
Why do spreads appear between tokenized stocks and underlying US equities?
Spreads arise due to liquidity differences, different trading hours, short-selling constraints, borrowing costs, and investor sentiment. Limits to arbitrage prevent rapid convergence of spreads and may even cause them to persist for a long time.
How can arbitrageurs manage funding rate volatility risk?
They can dynamically adjust positions, use hedging instruments (such as options), or choose periods when the funding rate is relatively stable to enter positions. At the same time, set stop-losses and margin buffers to avoid expanding losses from funding rate reversals.
Which indicators deserve continuous monitoring?
Key indicators include the funding rate (8-hour/annualized), borrowing rates, initial margin rate, maintenance margin rate, bid-ask spread, and open interest. These indicators collectively reflect arbitrage costs and leverage constraints.
Related Terms
Ready to try? Test the strategy on MSX with small positions. Educational content only — not investment advice.